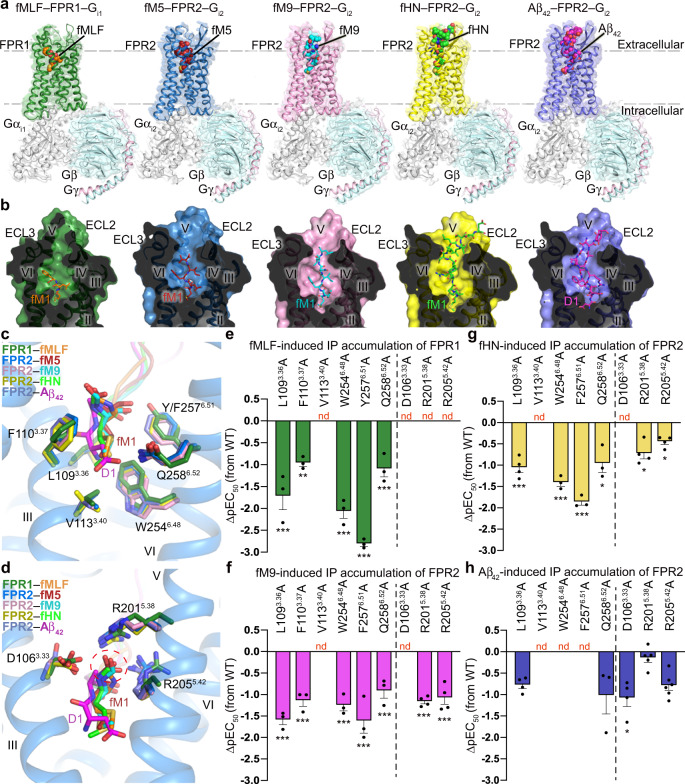
Fig. 1. Overall structures and ligand-binding pockets in peptide agonist–FPR–Gi complexes.
a Overall structures of fMLF–FPR1–Gi1, fM5–FPR2–Gi2, fM9–FPR2–Gi2, fHN–FPR2–Gi2, and Aβ42–FPR2–Gi2 complexes. The cryo-EM maps and structures are colored according to chains. The peptide ligands are shown as spheres. b Cut-away view of ligand-binding pockets in the peptide agonist–FPR–Gi structures. The receptors are shown as surface and cartoon representations. The ligands are shown as sticks. c, d Interactions between the FPRs and the N termini of the peptide agonists. The N-terminal residue fM1 of the peptides in the structures of fMLF–FPR1–Gi1, fM5–FPR2–Gi2, fM9–FPR2–Gi2, and fHN–FPR2–Gi2, and the N-terminal peptide residues D1 and A2 in the Aβ42–FPR2–Gi2 structure are shown as sticks. The receptor residues that interact with the peptide N termini are also shown as sticks. Only the receptor in the fM5–FPR2–Gi2 structure is shown in blue cartoon representation for clarity. c Interactions between the FPRs and the side chains of the peptide N termini. d Interactions between the FPRs and the N-formyl groups at the N termini of the peptides. The N-formyl groups are highlighted by a red dashed circle. e–h Peptide agonist-induced IP accumulation of FPR1 and FPR2 mutants. Bars represent differences in calculated peptide agonist potency (pEC50) for each mutant relative to the wild-type receptor (WT). Data are shown as mean ± SEM (bars) from at least three independent experiments performed in triplicate with individual data points shown (dots). *P < 0.05, **P < 0.001, ***P < 0.0001 by one-way analysis of variance followed by Dunnett’s post-test compared with the response of the wild-type receptor. Supplementary Table 3 provides detailed statistical evaluation, P-values, numbers of independent experiments (n), and expression levels. Source data are provided as a Source Data file.

