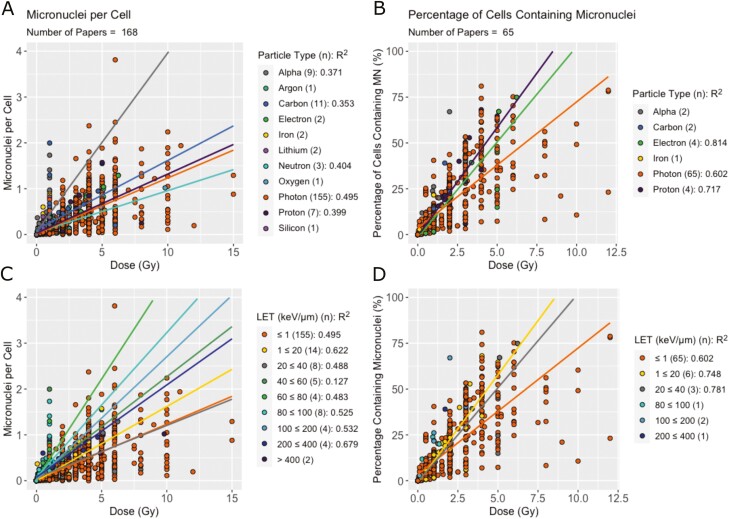
Figure 4.
Effect of physical factors on MN produced per dose. (A) MNPC per dose and (B) PCMN per dose split by particle type. The number of studies presenting results for each particle type is shown in brackets. Linear regressions were performed where there were three or more papers and are shown with trend lines and R2 values on the figure. (C) MNPC and (D) PCMN per dose split by LET.

