Figure 4.

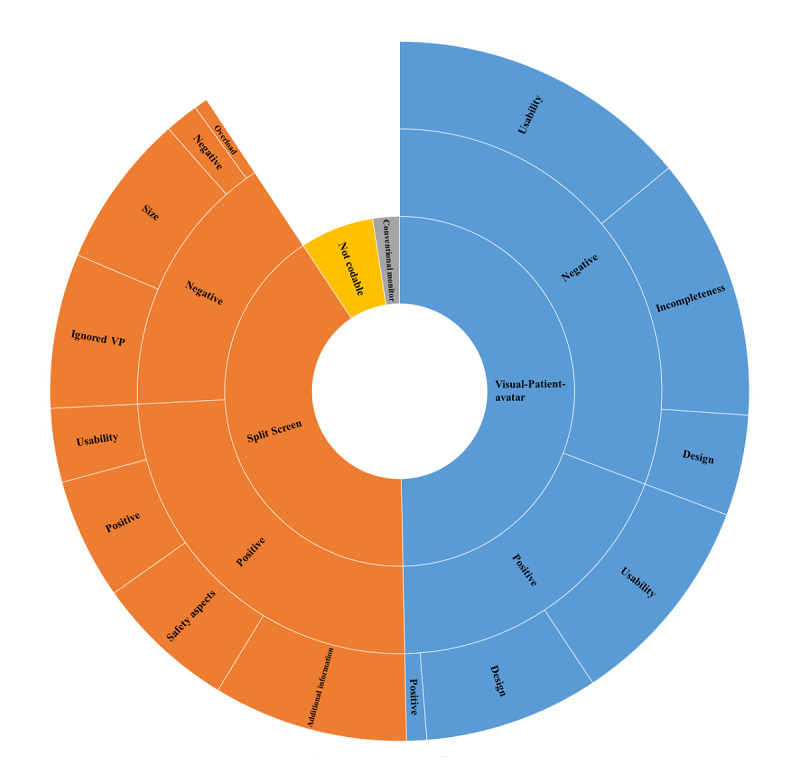
Sunburst diagram to reflect the user perceptions of the 3 different monitor settings. The width of a section represents the respective percentage of the topic on all given statements (N=307). Ignored VP: ignored Visual-Patient-avatar.

Sunburst diagram to reflect the user perceptions of the 3 different monitor settings. The width of a section represents the respective percentage of the topic on all given statements (N=307). Ignored VP: ignored Visual-Patient-avatar.