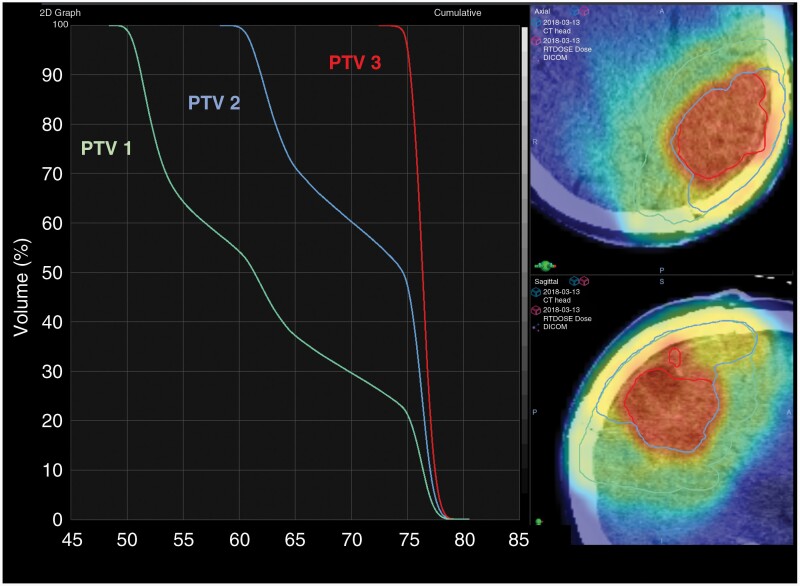
Figure 2.
For the patient in Figure 1, an RT dose-volume histogram is shown on the left for each PTV volume. Overlays of each PTV (PTV1 green line, PTV2 blue line, PTV3 red line) and radiation dose cloud over the patient’s treatment planning CT are shown.

