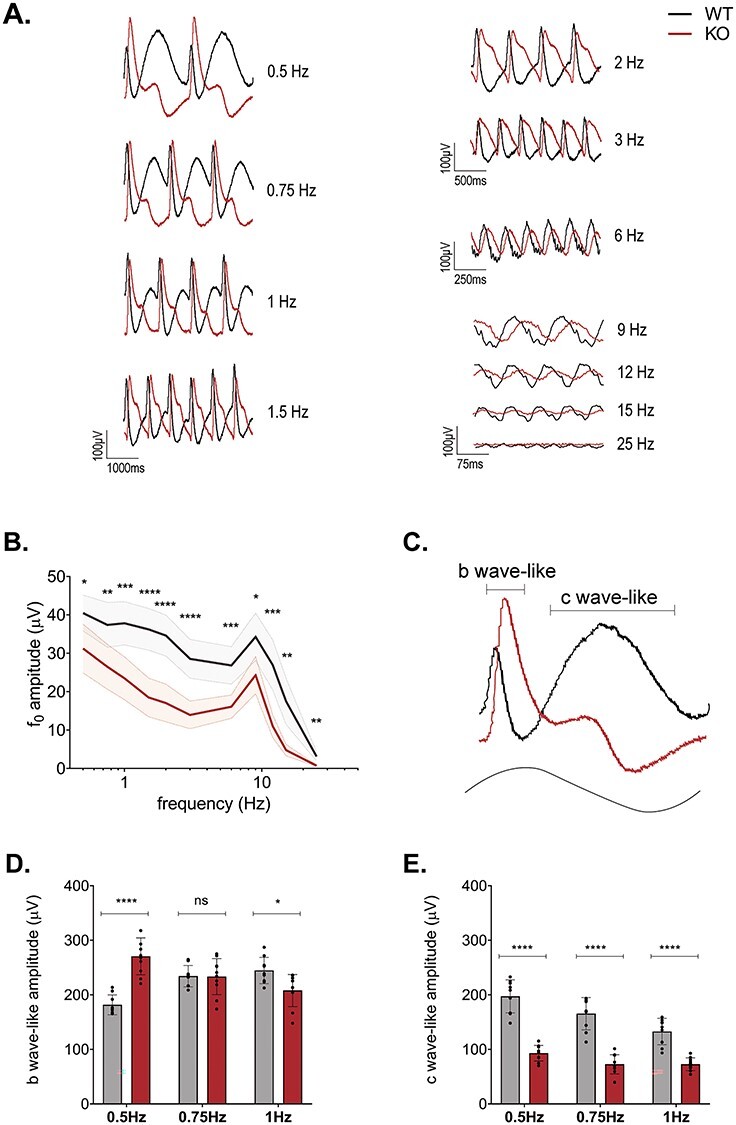
Figure 3.

Flicker ERG reveals complex alteration to dynamic signaling in Kv8.2 KO. (A) Representative ERG traces of WT (black) and Kv8.2 KO (red) to a sinusoidal flicker of increasing frequency at log 0 cd/m2 with 100% contrast. (B) Amplitude of the fundamental component (f0) as a function of the flicker frequency. (C) Single cycle response to a 0.5 Hz flicker with the ‘b wave-like’ and ‘c wave-like’ components of the response shown with brackets. (D) Amplitude of the b wave-like component and (E) c wave-like component at 0.5, 0.75 and 1 Hz.
