
Figure 2.
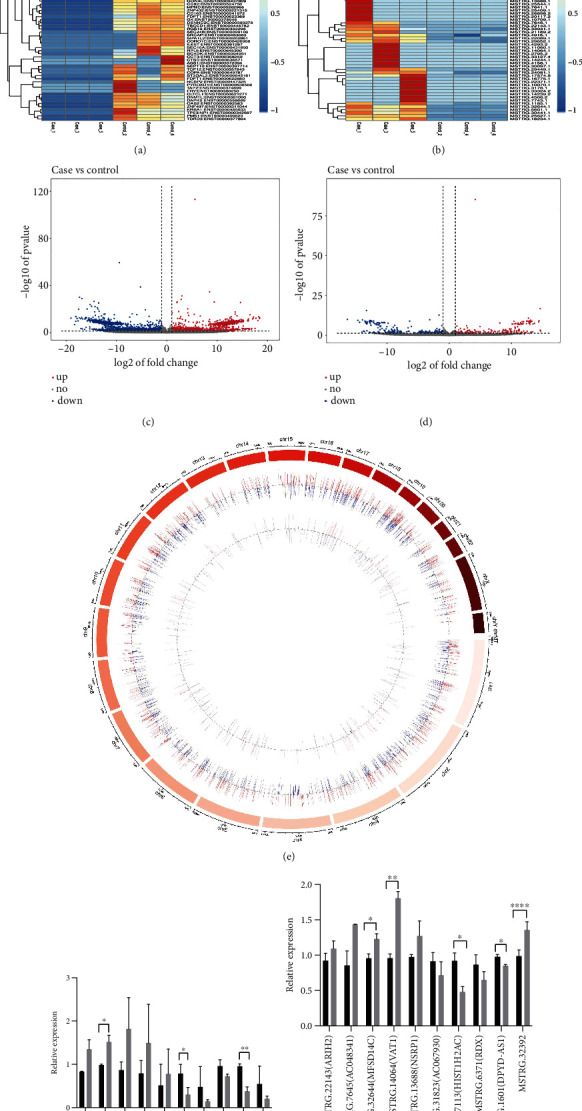
lncRNAs along with mRNAs with their differential expression between THP-1 cells (n = 3) infected with Cryptococcus neoformans and uninfected control groups (n = 3). (a and b) Heat map of mRNA along with novel lncRNA expression. (c and d) Volcano plot of mRNA besides novel lncRNA expression; red dots depict upregulation of RNAs with P value < 0.05 along with a fold change ≥ 1, while blue dots illustrate downregulation of RNAs with P value < 0.05 along with a fold change ≤ −1. (e) Distribution of chromosomes for lncRNAs along with mRNAs with their differential expression are demonstrated, respectively, by the outer circle to the inner circle. Moreover, downregulation is represented by green, upregulation is represented by red, and gene enrichment is represented by the height of the bars. Case: C. neoformans-infected THP-1 cells; Control: normal THP-1 cells. (f and g) The top 10 differentially expressed mRNAs and lncRNAs for the real-time PCR validation of relative expression in C. neoformans (WM148)-infected THP-1 cells compared to controls. 0 h represents THP-1 cells without treated with WM148; 6 h represents THP-1 cells were treated with WM148 for 6 h. All results are expressed as mean ± SD from three independent experiments. ∗P < 0.05 and ∗∗P < 0.01 compared with the control group (0 h).