
Figure 3.
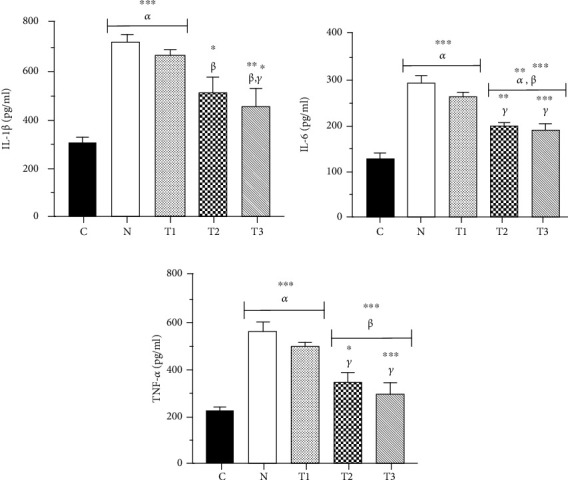
Concentrations of IL-1β (a), IL-6 (b), and TNF-α (c) in the liver of rats. Each column represents the mean ± SEM (n = 6). ∗P < 0.05, ∗∗P < 0.01, and ∗∗∗P < 0.001. α, β, and γ compared to the C, N, and T1 groups, respectively.
Official websites use .gov
A
.gov website belongs to an official
government organization in the United States.
Secure .gov websites use HTTPS
A lock (
) or https:// means you've safely
connected to the .gov website. Share sensitive
information only on official, secure websites.
Concentrations of IL-1β (a), IL-6 (b), and TNF-α (c) in the liver of rats. Each column represents the mean ± SEM (n = 6). ∗P < 0.05, ∗∗P < 0.01, and ∗∗∗P < 0.001. α, β, and γ compared to the C, N, and T1 groups, respectively.