Figure 9.

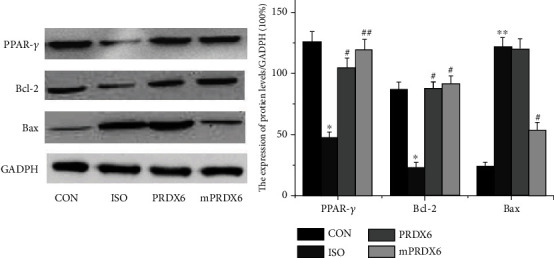
Western blot analysis of expression levels of PPAR-γ, Bcl-2, and Bax proteins. ∗P < 0.05 vs. CON group; ∗∗P < 0.01 vs. CON group; #P < 0.05 vs. ISO group; and ##P < 0.01 vs. ISO group.

Western blot analysis of expression levels of PPAR-γ, Bcl-2, and Bax proteins. ∗P < 0.05 vs. CON group; ∗∗P < 0.01 vs. CON group; #P < 0.05 vs. ISO group; and ##P < 0.01 vs. ISO group.