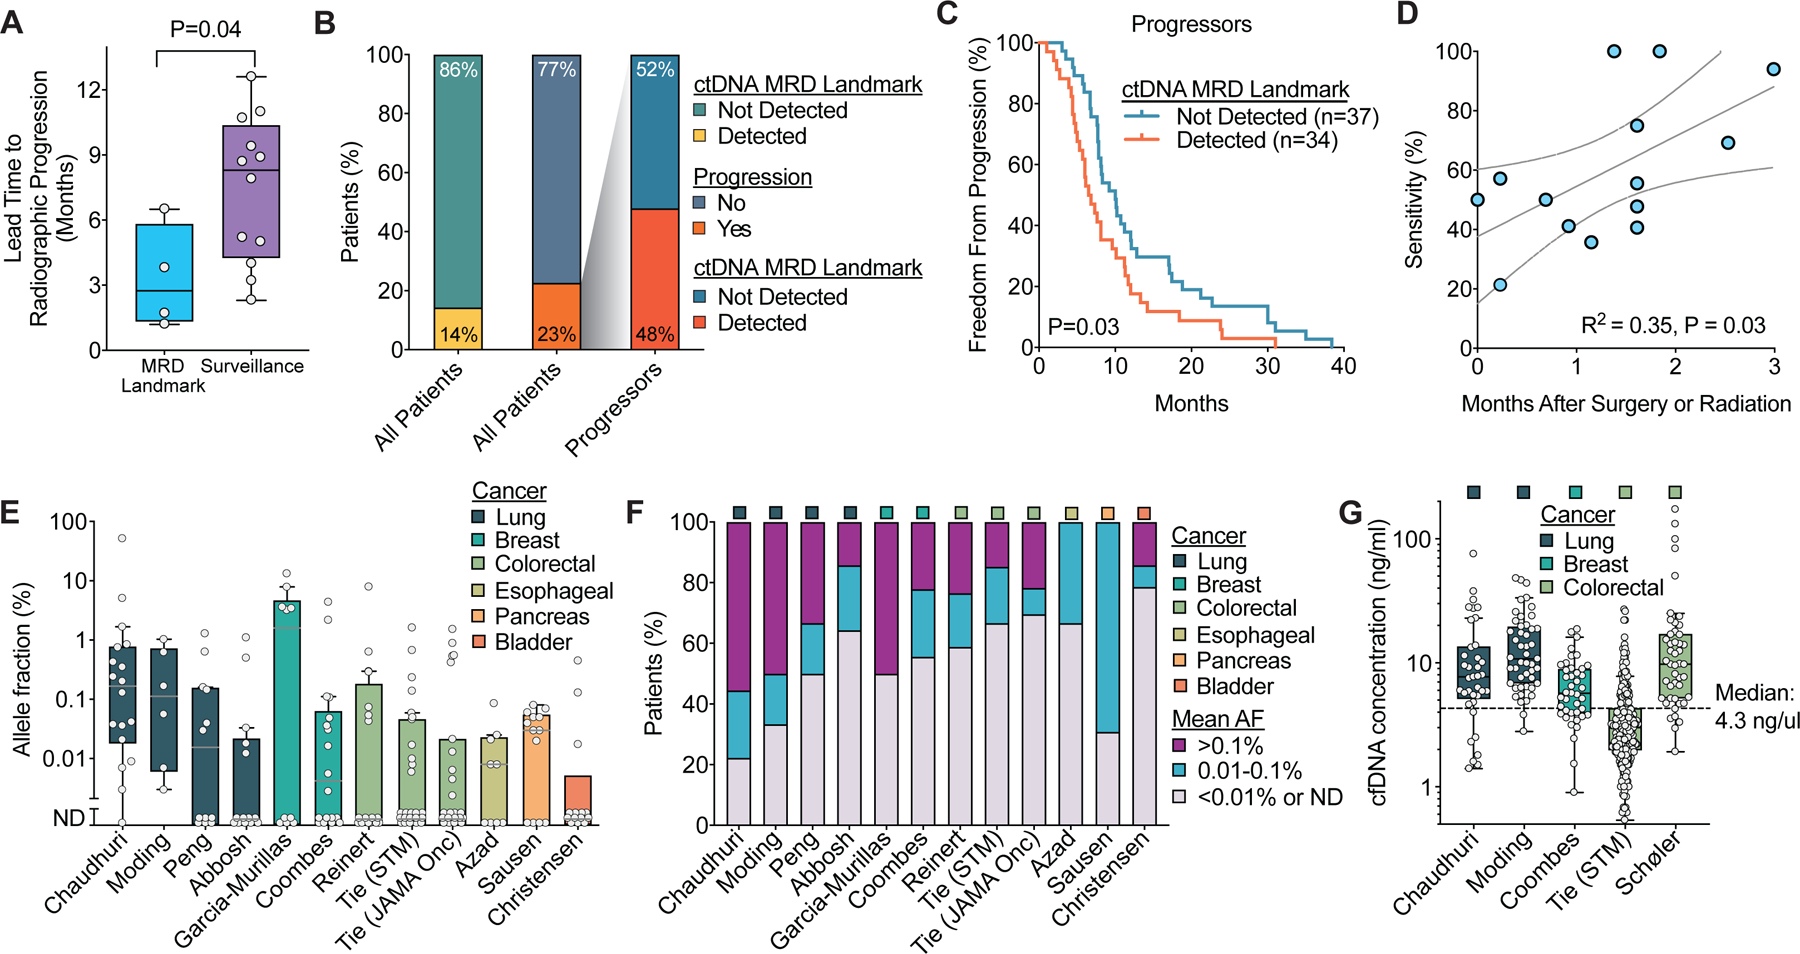
Figure 3:

Summary of lead times and ctDNA levels after curative-intent therapy in solid tumors. A) Comparison of lead time from blood draw to progression on standard of care imaging for ctDNA MRD landmark (65,90,92,108) and ctDNA surveillance studies (27,28,31,34–36,62,91,111–114). Boxes represent median and interquartile range (IQR) and whiskers represent 1.5 times the IQR per the Tukey method. B-C) Analysis of outcomes by ctDNA status at the MRD landmark among patients who ultimately developed progressive disease using the studies from Figure 2E to assess the possibility that patients who are ctDNA negative at the MRD landmark but ultimately progress have more indolent disease. B) Stacked box plot summarizing the proportion of all patients and proportion of progressors with ctDNA MRD detected. C) Freedom from progression from the start of therapy based on ctDNA MRD detection only in patients who developed progressive disease. P-value calculated using a two-sided log-rank test. D) Linear correlation of clinical sensitivity for landmark MRD studies with the median time after completing surgery or radiation therapy for the ctDNA landmark blood draw. Studies with a median time of greater than 20 weeks were excluded. Line of best fit is shown with 95% confidence intervals. E) Box plots of mean ctDNA allele fraction at the first post-treatment time point across studies in patients who ultimately relapsed. Only studies with allele fractions reported are included. Boxes represent median and IQR and whiskers represent 1.5 times the IQR per the Tukey method. F) Distribution of mean allele fractions at the first post-treatment time point in the studies from E. G) Box plots of cfDNA concentration at the first blood draw after completing local therapy across studies. Boxes represent median and IQR and whiskers represent 1.5 times the IQR per the Tukey method.
