FIGURE 2.

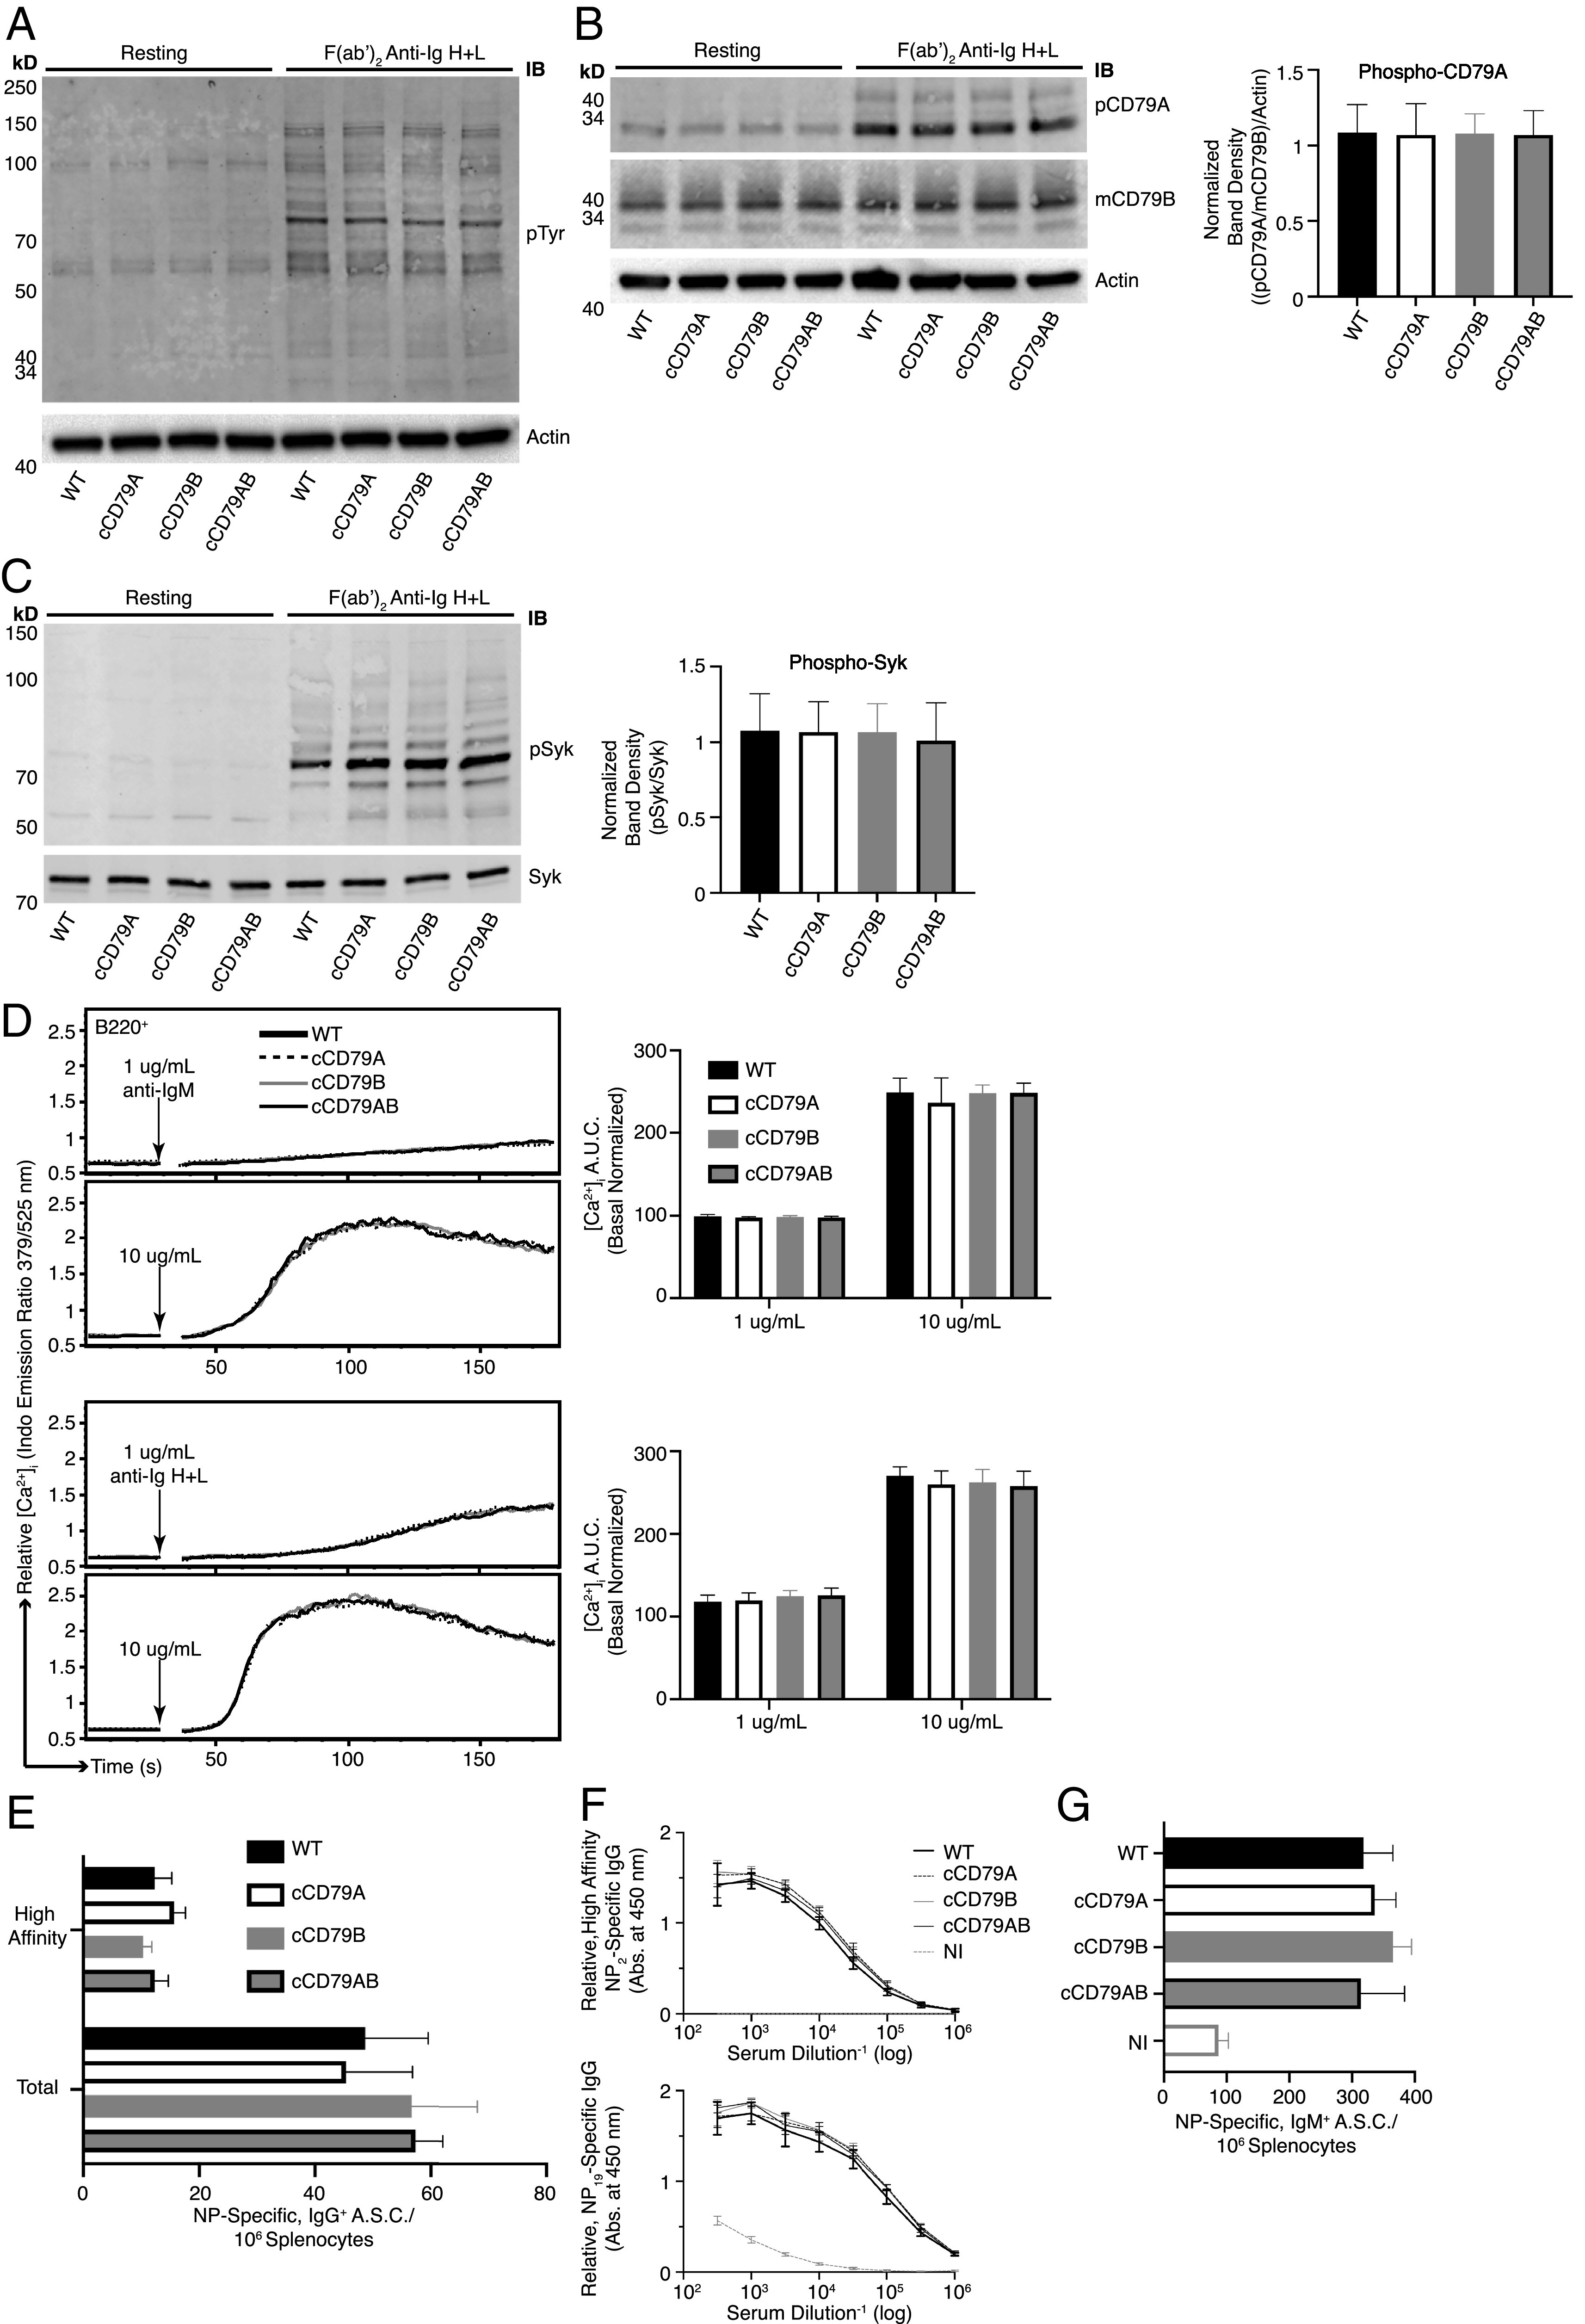
BCR signaling and B cell immune responses are unaffected by expression of cCD79. (A) BCR-mediated global tyrosine phosphorylation in chimeric and control B cells. Cell equivalents (2 × 10⁶; CD43−) per lane, resting or stimulated with 10 µg/ml rabbit F(ab′)2 anti-mIg (H+L) for 5 min. Unstimulated cells were run in parallel (left four lanes) to show basal phosphorylation levels. Protein-laden PVDF membranes probed with Abs against p-Tyr (4G10) and actin. (B) BCR-mediated CD79A phosphorylation. Prepared as in (A), probed with anti–p-CD79A (Y182) (rabbit polyclonal anti-mouse pCD79A [Y182]). An anti-mCD79B (see (Fig. 1E), which recognizes the cytoplasmic tail of mCD79B, was used together with actin to normalize the relative abundance of phosphorylated mCD79A (p-CD79A/p-CD79B/actin). Normalized band densities are depicted to the right. (C) BCR-mediated Syk phosphorylation. Prepared as in (A), probed with anti–p-Syk (Y252) (polyclonal rabbit anti–p-Syk [Y525/526]) and biotinylated anti-Syk (in-house) followed by fluorescently conjugated streptavidin. Relative, normalized band densities (pSyk/Syk) are depicted to the right. (D) Representative relative intracellular free calcium before and after BCR stimulation. Splenocytes, stained with anti-B220 and loaded with Indo-1 AM, were stimulated with 1 or 10 µg/ml F(ab′)2 of either goat anti-mIgM (upper traces) or rabbit anti-mIg (H+L) (lower), approximating IgM-only and total BCR stimulation, respectively. Poststimulation, basal-normalized area under the curve (AUC) is depicted on the right. (E) Total (NP19-binding) and high affinity (NP2-binding) IgG+ ELISPOT quantification, 16 d postimmunization with NP-conjugated OVA in alum. (F) Relative serum concentrations of IgG anti-NP Abs from mice immunized in (E) at 16 d postimmunization. NI, not immunized. (G) Total (NP19 binding) IgM+ ELISPOT quantification, at 7 days postimmunization with NP59-Ficoll. n = 3 male and 3 female mice per group. Error bars show SEM. All data represent at least three independent experiments; representative data are shown.
