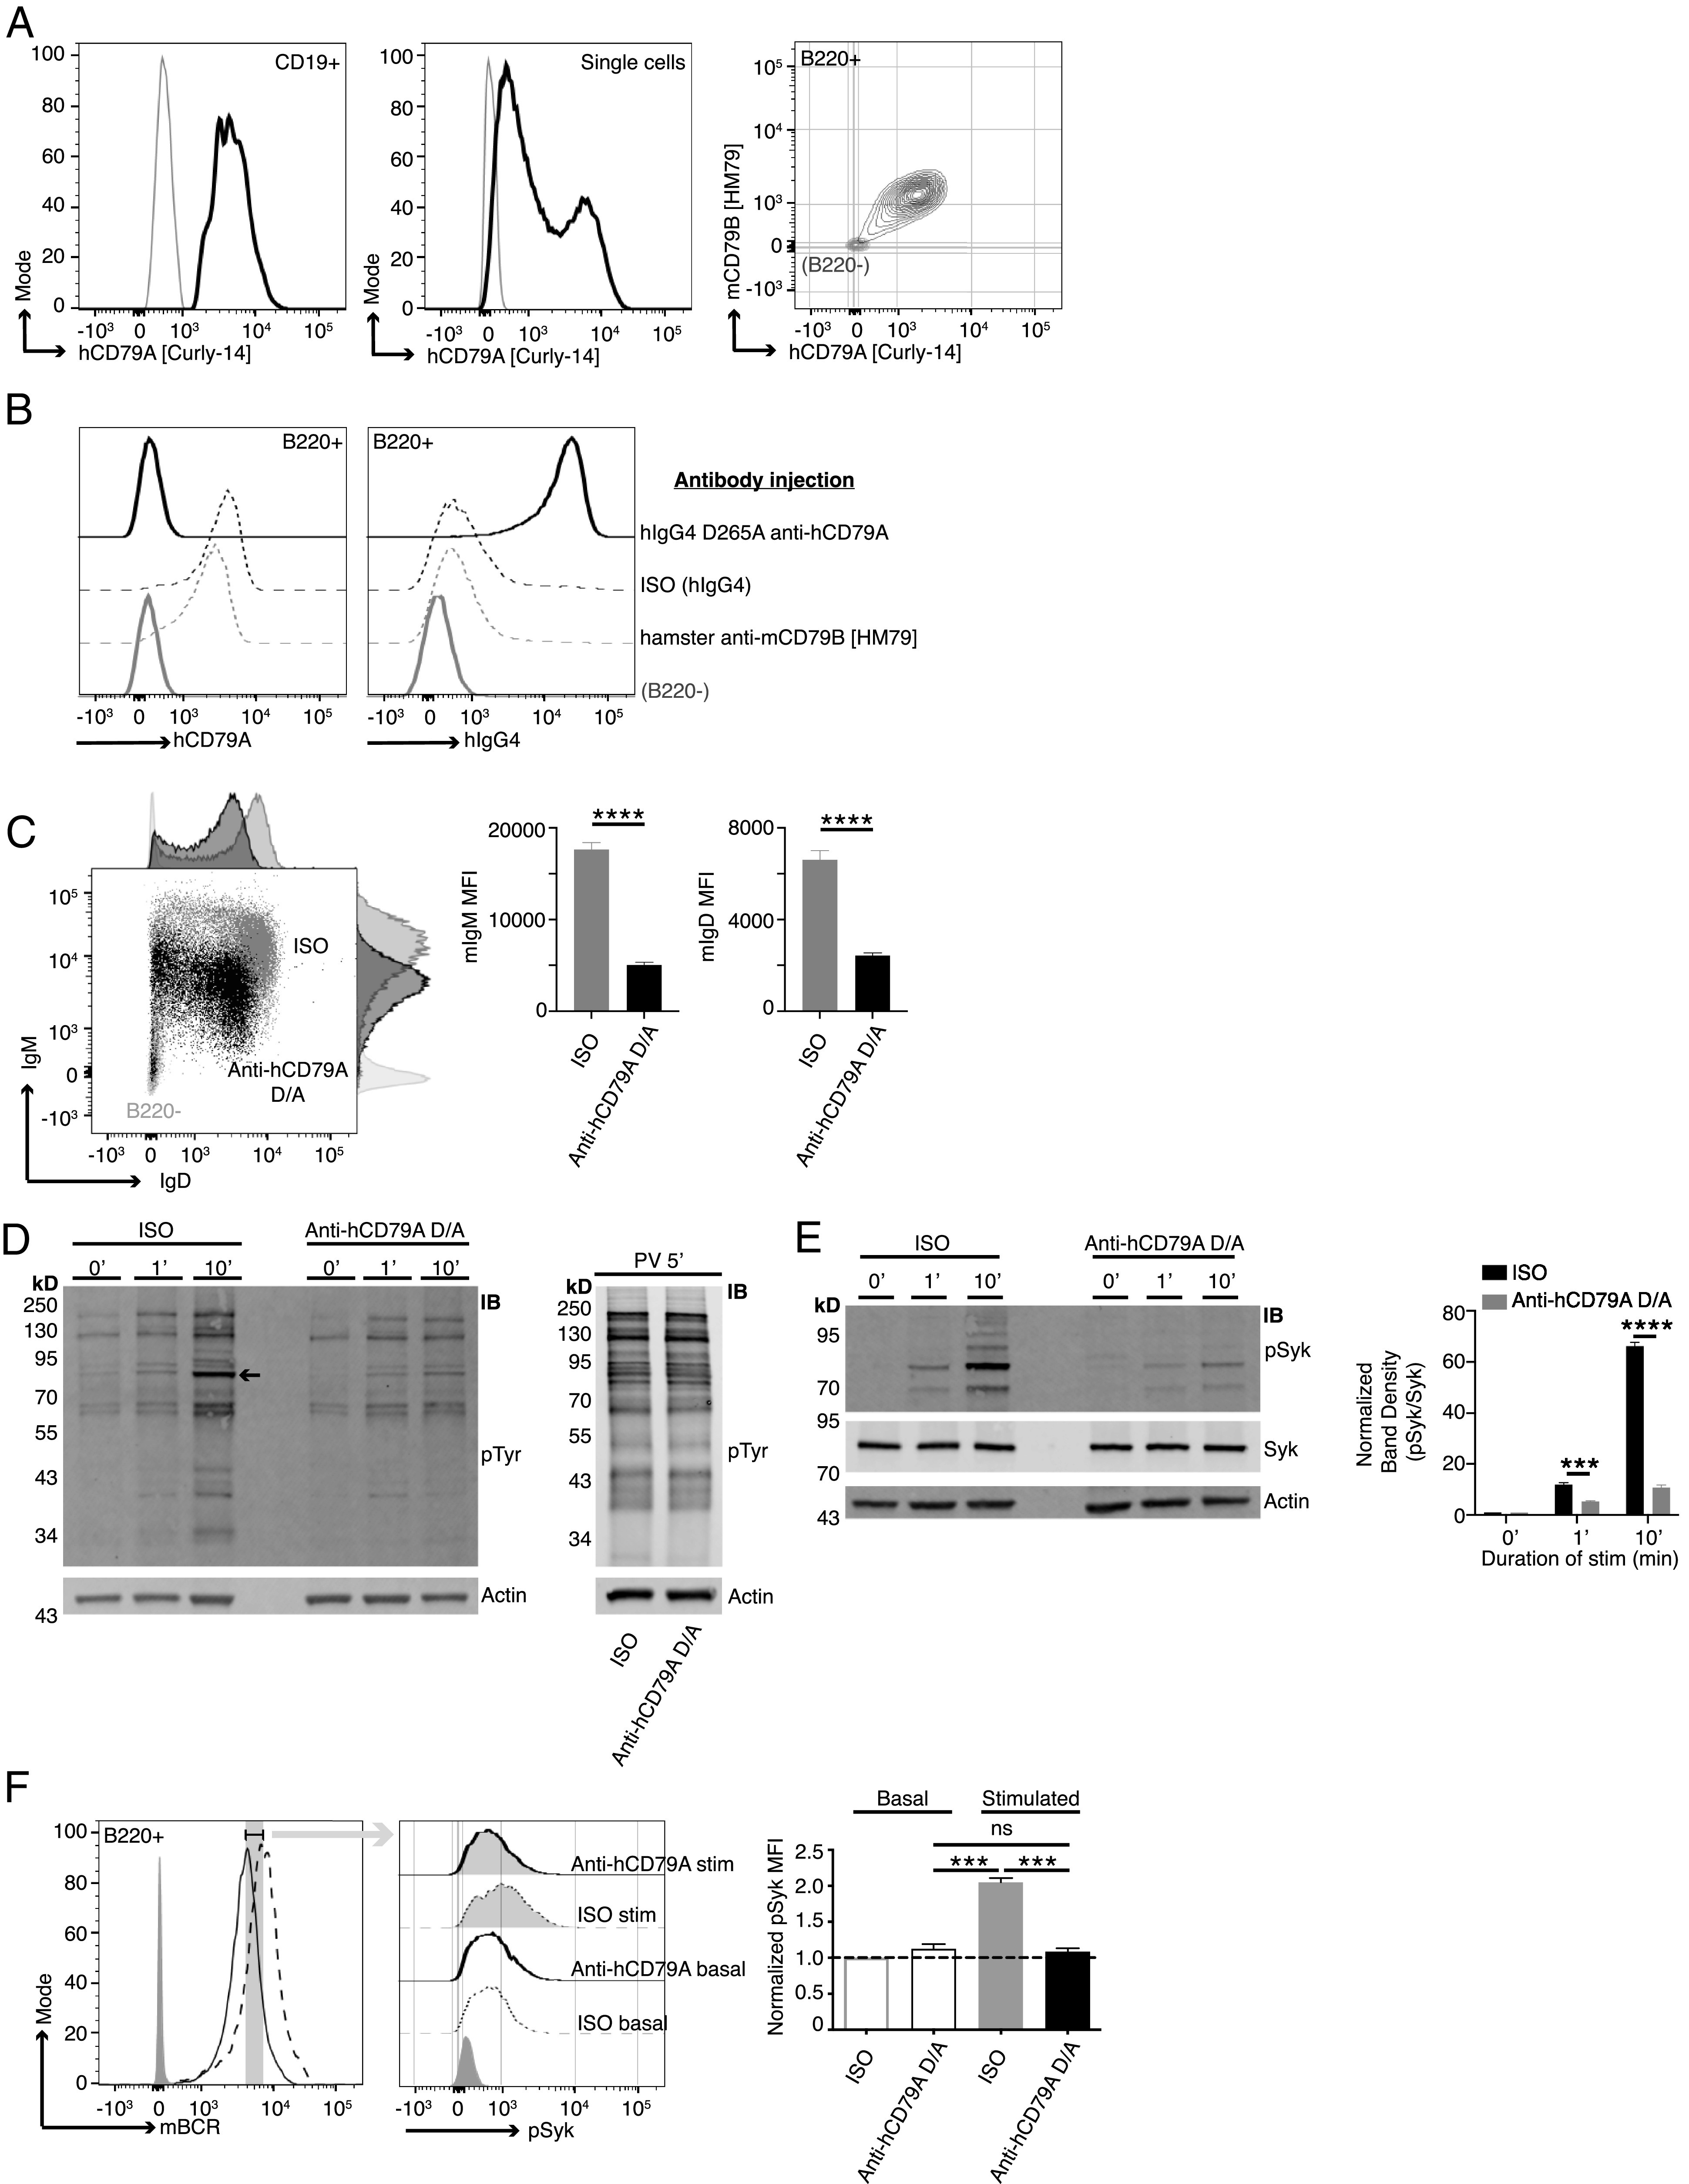
FIGURE 3.

Anti-hCD79A treatment induces an anergic-like phenotype in B cells. (A) Surface staining of PBMCs (left) and Ramos cells (middle) with anti-hCD79A (Curly-14). Dual staining of cCD79A+/+B−/− knockin splenocytes (right) with anti-hCD79A (Curly-14) and anti-mCD79B (HM79). Gray lines indicate CD19−, ns, and B220− for PBMCs, Ramos cells, and cCD79A knockin splenocytes, respectively. (B) Binding of the humanized anti-hCD79A clinical candidate to cCD79A/cCD79B cells. Eighteen hours prior to assay, cCD79A knockin mice received 250-µg i.p. injections of either hIgG4 D265A anti-hCD79A (solid black line), hIgG4 isotype control (dashed black line), or hamster anti-mCD79B (HM79) (dashed gray line). RBC-lysed splenocytes were stained with anti-B220 and either anti-hCD79A (Curly-14) (left) or anti-hIgG4 (right). Solid gray lines represent B220−. (C) Surface expression of IgM and IgD on cCD79 B cells (B220+) 18 h after i.p injection with 250 µg of either hIgG4 D265A anti-hCD79A (black) or isotype control hIgG4 (gray). Light gray histograms show B220−. (D) Western blot analysis of global tyrosine phosphorylation. Eighteen hours prior to assay, cCD79A mice were injected i.p. with 250 µg of either anti-hCD79A D265A or hIgG4 isotype control. Splenic B cells were purified by CD43 exclusion and stimulated with 10 µg/ml F(ab′)2 goat anti-mIgM for the indicated number of minutes (left) or stimulated with 1× pervanadate for 5 min (right). Whole-cell lysates of 2 × 10⁶ B cell (CD43−) equivalents, both stimulated and not, were separated by SDS-PAGE and transferred to PVDF membranes. Protein-transferred membranes were blotted with Abs against p-Tyr (4G10) and actin. (E) Western blot analysis of Syk phosphorylation. Eighteen hours prior to assay, cCD79A mice were injected i.p. with 250 µg of either anti-hCD79A D265A or hIgG4 isotype control. Splenic B cells were purified by CD43 exclusion and stimulated with 10 µg/ml F(ab′)2 goat anti-mIgM for the indicated number of minutes. Whole-cell lysates of 2 × 10⁶ B cell (CD43−) equivalents, both stimulated and not, were separated by SDS-PAGE and transferred to PVDF membranes. Protein-transferred membranes were blotted with Abs against p-Syk (Y525), total Syk, and actin. A densitometric summary of p-Syk/Syk is shown on the right. (F) Flow cytometric analysis of Syk phosphorylation as a function of mBCR expression. Mice were treated as in (E) before RBC-lysed splenocytes were stimulated as above for 5 min. Fixed cells were stained with fluorescent Abs against B220 and mBCR. After permeabilization, cells were stained with anti–p-Syk (Y525). B cells were gated on equivalent mBCR expression (left) before comparing p-Syk mean fluorescence intensities (MFIs) (middle and right). Error bars show SEM. All data represents at least three independent experiments; representative data are shown. A Student t test used to evaluate statistical significance. ***p < 0.001, ****p < 0.0001.
