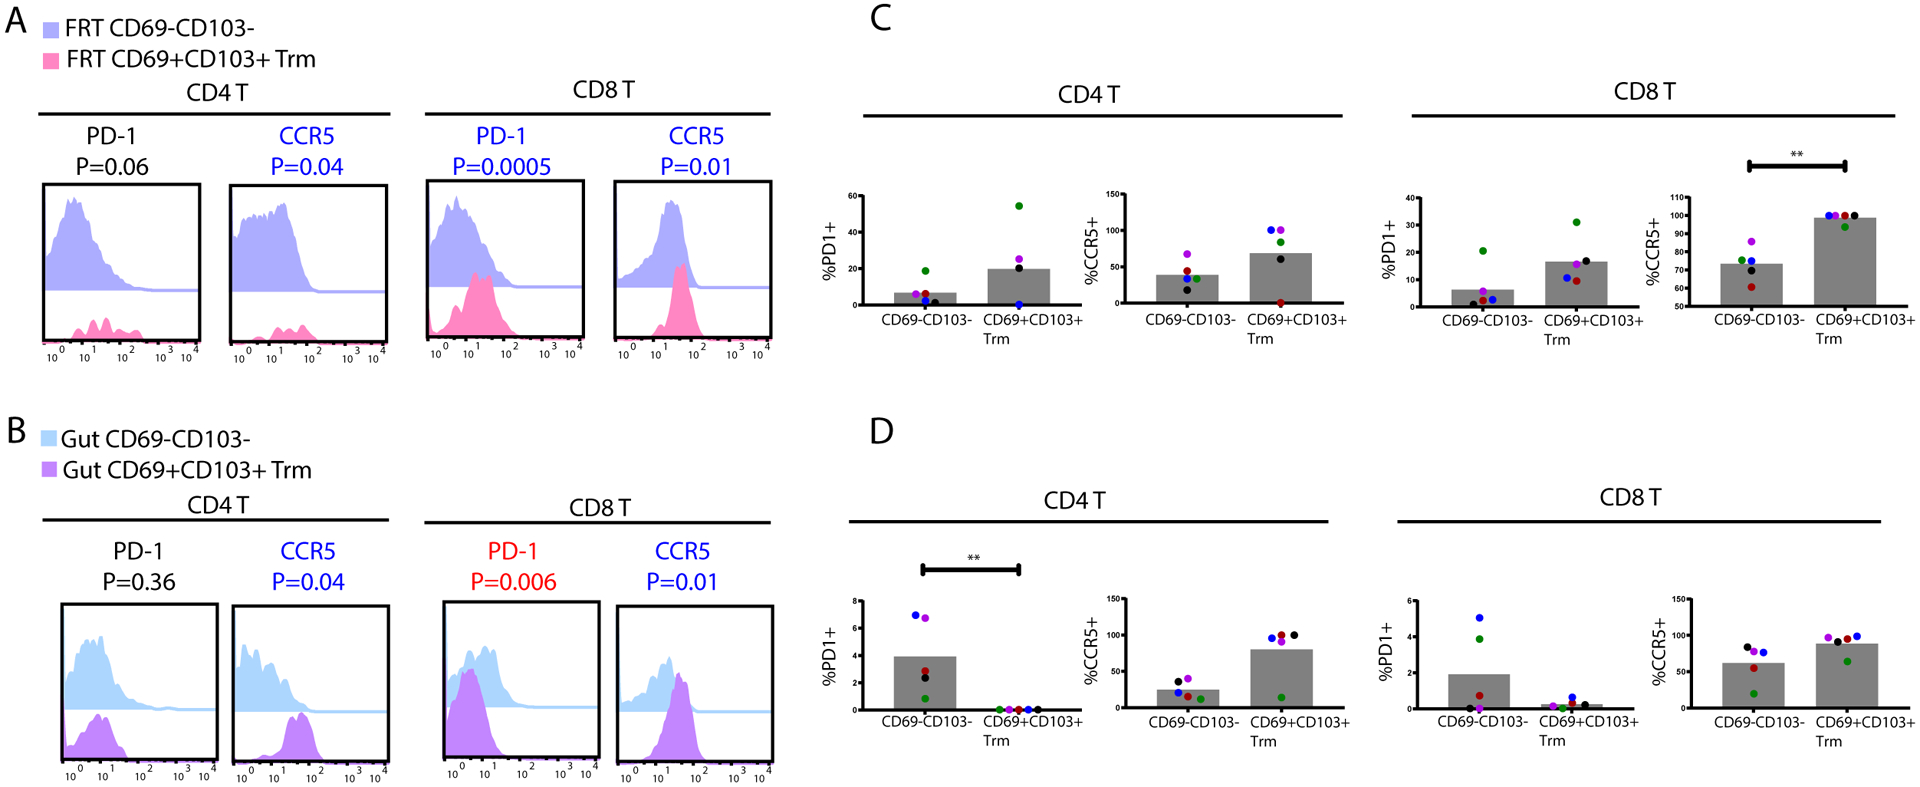
Figure 6. Phenotypic features of CD69+CD103+ Trm cells in tissues.

FRT (A) and gut (B) CD69+CD103+ Trm cells express higher levels of PD1 and CCR5 relative to their respective CD69-CD103- T memory (Tm) counterparts. Shown are overlaid histograms from the CD4+ (left) and CD8+ (right) T cell subsets, corresponding to concatenated events from all donors. Antigens significantly (p < 0.05) overexpressed among the CD69+CD103+ populations are in blue font, while those underexpressed are in red font. P-values were determined by a Student’s paired t-test and adjusted for multiple testing using the Benjamini-Hochberg for FDR. The proportions of CD69-CD103- vs. CD69+CD103+ Tm cells from FRT (C) or gut (D) were compared by manual gating for the percentages of cells expressing PD1 or CCR5. * p < 0.05 and ** p < 0.01 as determined by a Mann-Whitney U test (n=5 donors).
