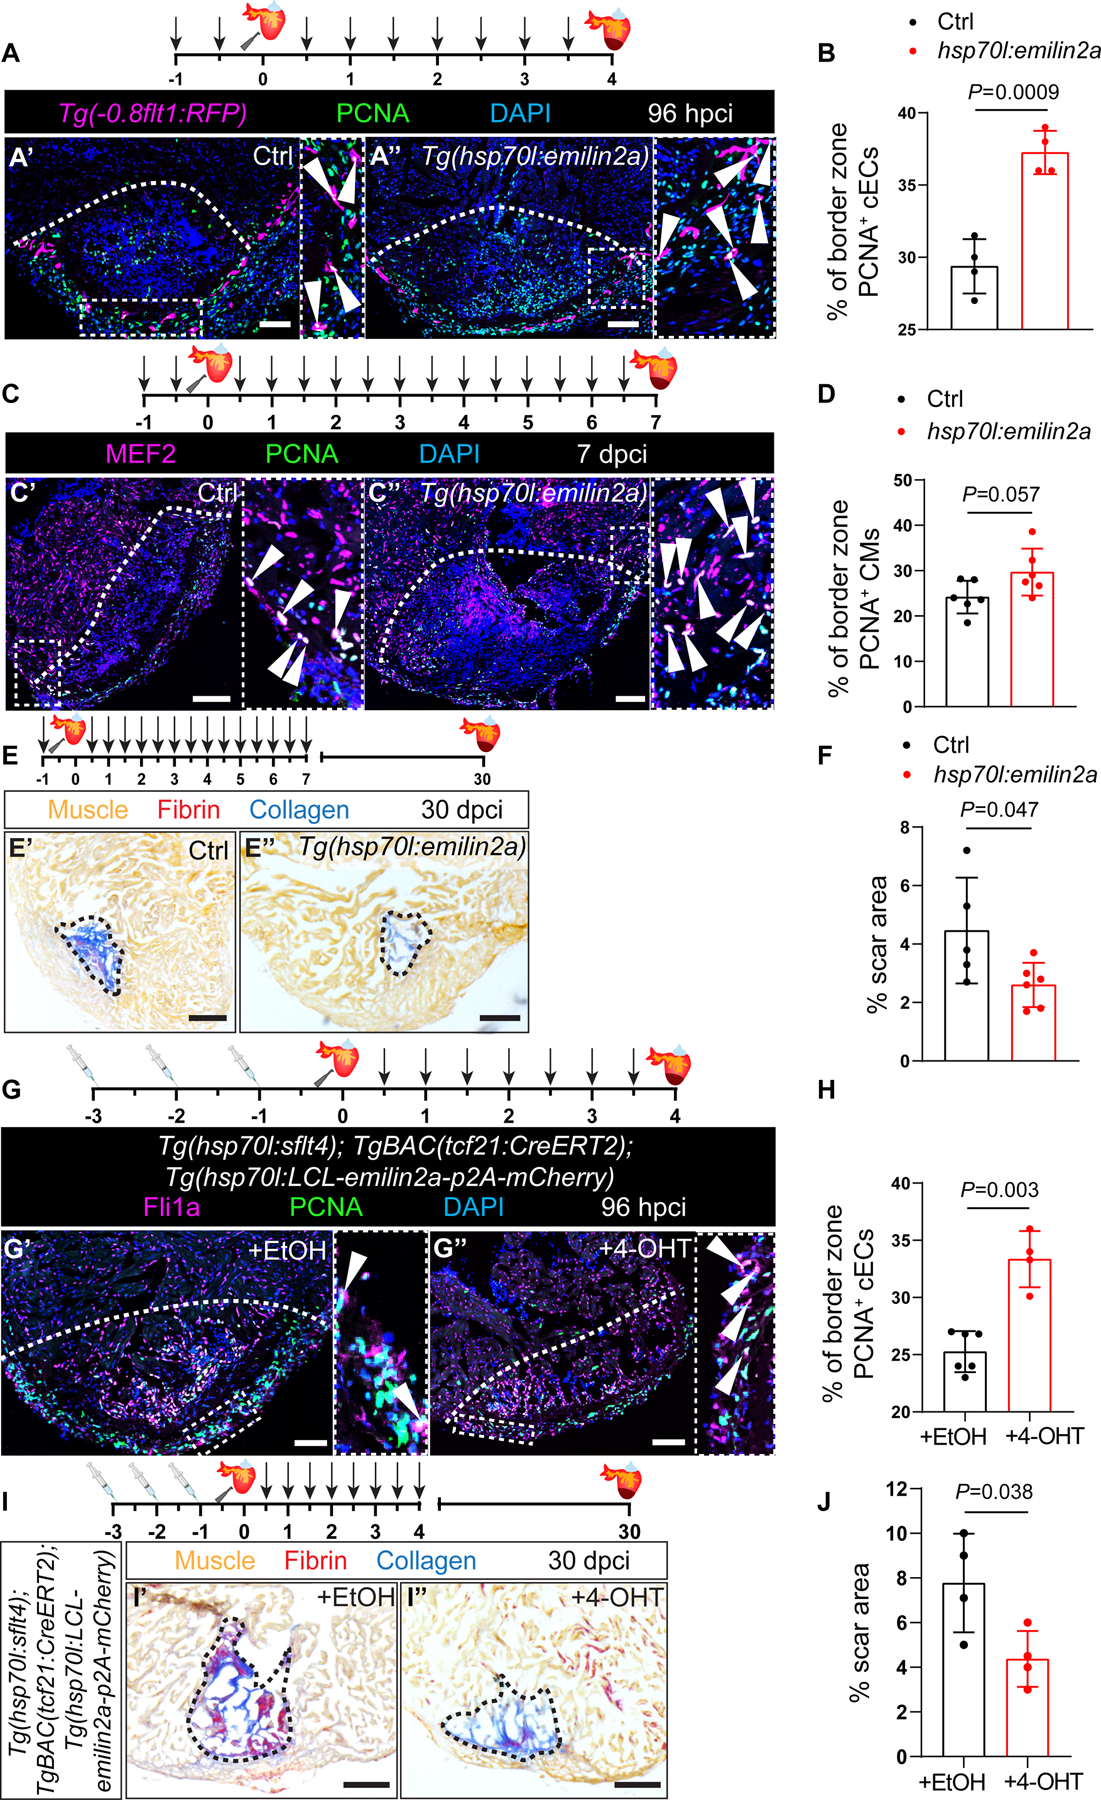
Figure 4: emilin2a overexpression increases coronary endothelial cell proliferation and can rescue Vegfc signaling block in regenerating zebrafish hearts.

A. Schematic representation of heat shock treatments (arrows) and cardiac cryoinjury. Immunostaining of sections of cryoinjured hearts of Tg(0.8flt1:RFP) (Ctrl) (A’) and Tg(hsp70l:emilin2a); Tg(−0.8flt1:RFP) (A”) sibling zebrafish at 96 hpci; sections stained for RFP (coronaries, magenta), PCNA (proliferation marker, green), and DNA (DAPI, blue). Arrowheads point to PCNA+ cECs. B. Percentage of PCNA+ cECs in the border zone of Tg(−0.8flt1RFP) (Ctrl) (n=4) and Tg(hsp70l:emilin2a); Tg(−0.8flt1:RFP) ventricles (n=4) at 96 hpci. C. Schematic representation of heat shock treatments (arrows) and cardiac cryoinjury. Immunostaining of sections of cryoinjured hearts of non-transgenic sibling (Ctrl) (C’) and Tg(hsp70l:emilin2a) (C”) zebrafish at 7 dpci; sections stained for MEF2 (CMs, magenta), PCNA (proliferation marker, green), and DNA (DAPI, blue). Arrowheads point to PCNA+ CMs. D. Percentage of PCNA+ CMs in the border zone of non-transgenic sibling (Ctrl) (n=6) and Tg(hsp70l:emilin2a) (n=6) ventricles at 7 dpci. E. Schematic representation of heat shock treatments (arrows) and cardiac cryoinjury. AFOG staining of sections of non-transgenic sibling (Ctrl) (E’) and Tg(hsp70l:emilin2a) (E”) ventricles at 30 dpci. Orange, Muscle; red, Fibrin; blue, Collagen. F. Percentage of scar area relative to ventricular area in non-transgenic sibling (Ctrl) (n=5) and Tg(hsp70l:emilin2a) (n=6) ventricles at 30 dpci. G. Schematic representation of Ethanol (EtOH) or 4-hydroxytamoxifen (4-OHT) injections followed by cardiac cryoinjury and heat shock treatments (arrows). Immunostaining of sections of cryoinjured hearts of Tg(hsp70l:sflt4); TgBAC(tcf21:CreERT2); Tg(hsp70l:LCL-emilin2a-p2A-mCherry) zebrafish injected with EtOH (G’) or 4-OHT (G”) at 96 hpci; sections stained for Fli1a (endothelial cells, magenta), PCNA (proliferation marker, white), and DNA (DAPI, blue). Arrowheads point to PCNA+ cECs. H. Percentage of PCNA+ cECs in the border zone of Tg(hsp70l:sflt4); TgBAC(tcf21:CreERT2); Tg(hsp70l:LCL-emilin2a-mCherry) at 96 hpci injected with EtOH (n=6) or 4-OHT (n=4). I. Schematic representation of Ethanol (EtOH) or 4-hydroxytamoxifen (4-OHT) injections followed by cardiac cryoinjury and heat shock treatments (arrows). AFOG staining of sections of cryoinjured hearts of Tg(hsp70l:sflt4); TgBAC(tcf21:CreERT2); Tg(hsp70l:LCL-emilin2a-p2A-mCherry) zebrafish injected with EtOH (I’) or 4-OHT (I”) at 30 dpci. Orange, Muscle; red, Fibrin; blue, Collagen. J. Percentage of scar area relative to ventricular area in Tg(hsp70l:sflt4); TgBAC(tcf21:CreERT2); Tg(hsp70l:LCL-emilin2a-mCherry) at 30 dpci injected with EtOH (n=4) or 4-OHT (n=4). White (A,C,G), and Black (E,I) dotted lines delineate the injured tissue. Statistical test: Student’s t-test (B,D,F,H,J). Scale Bars: 100 μm (A,C,G), 200 μm (E,I).
