
Figure 6: Cxcl8a-Cxcr1 signaling promotes coronary endothelial cell proliferation after cardiac injury in zebrafish.
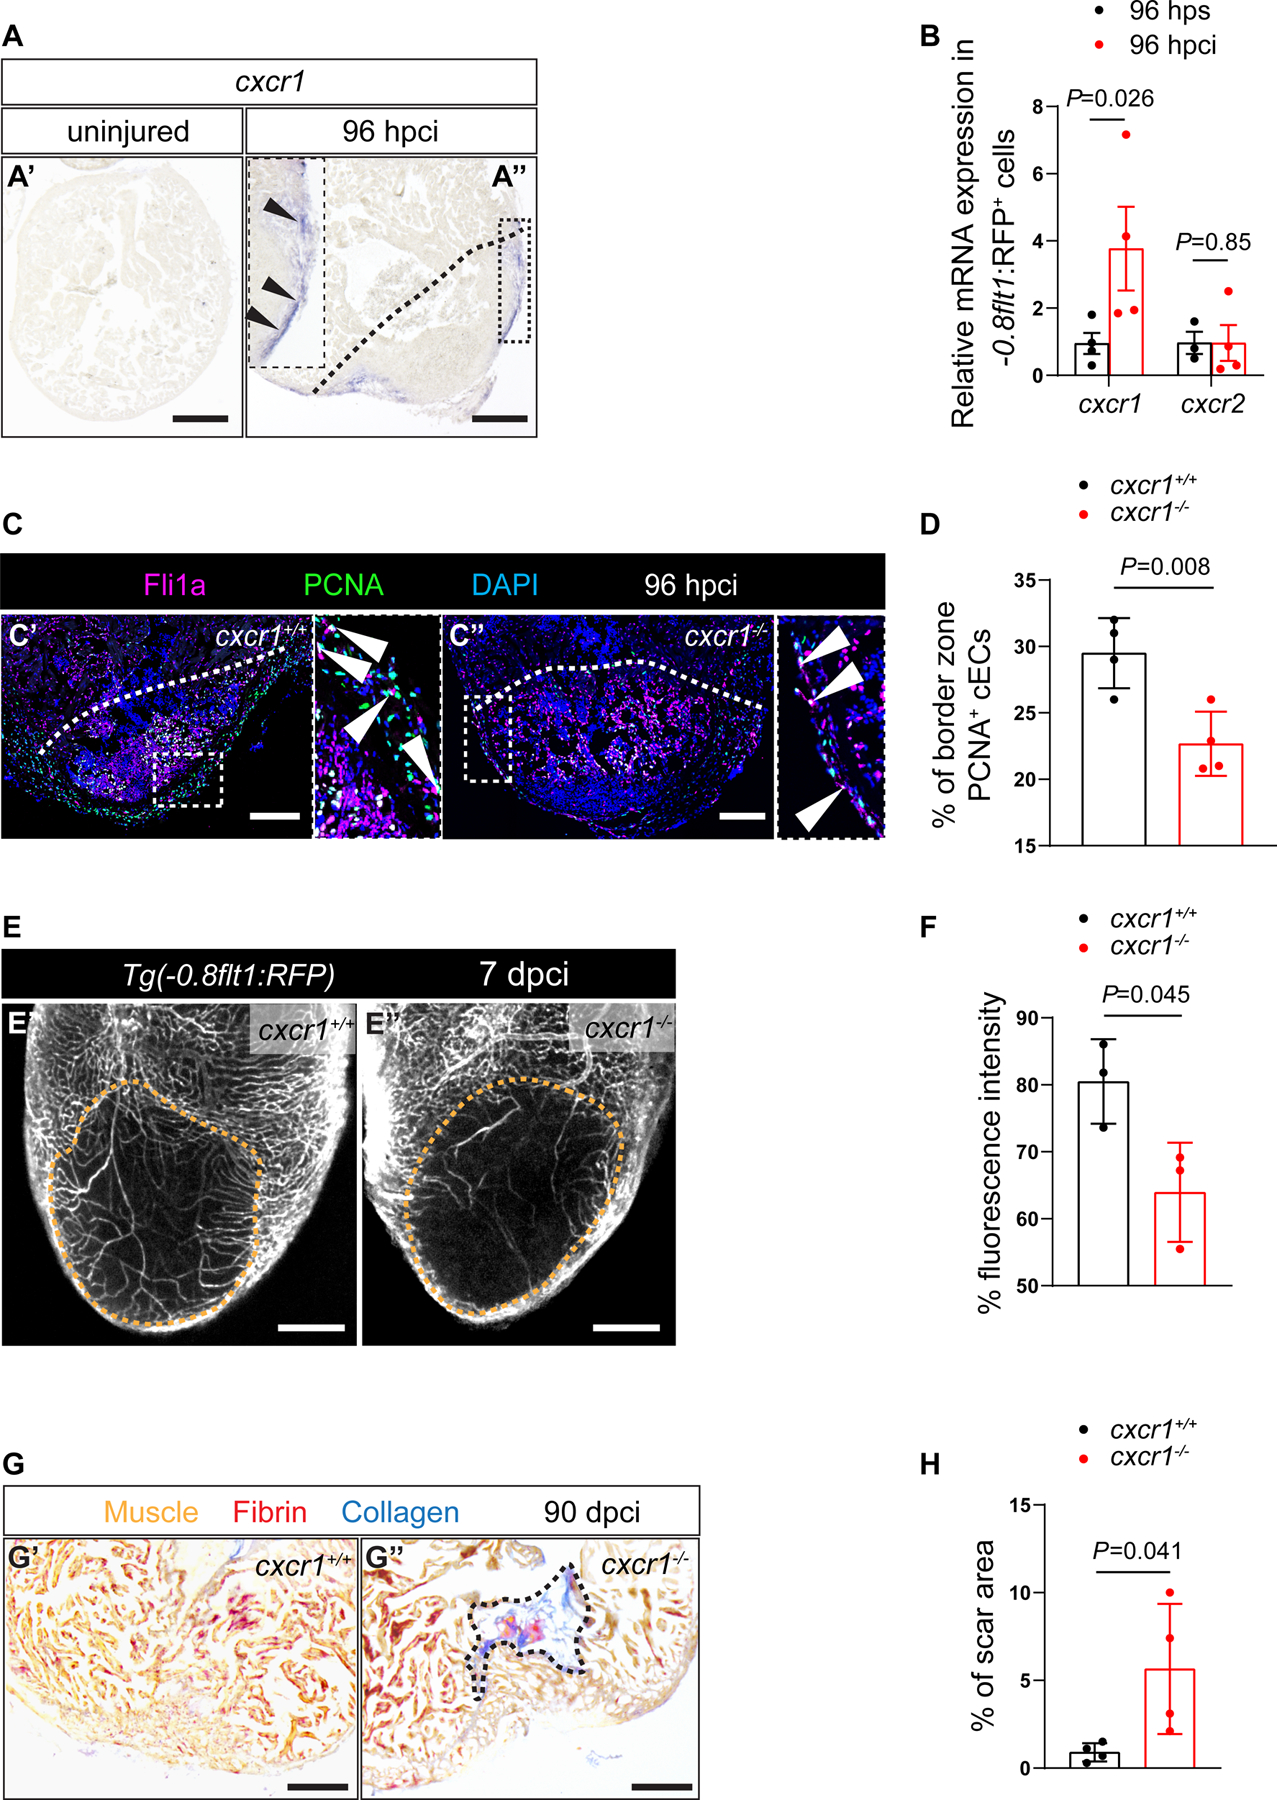
A. in situ hybridization for cxcr1 expression on sections of uninjured (A’) and 96 hpci (A”) hearts. Arrowheads point to cxcr1 expression. B. RT-qPCR analysis of cxcr1 and cxcr2 mRNA levels in sorted −0.8flt1:RFP+ cells (cECs) (n=3–4) at 96 hpci normalized to 96 hps. C. Immunostaining of sections of cryoinjured hearts of cxcr1+/+ (C’) and cxcr1−/− (C”) sibling zebrafish at 96 hpci; sections stained for Fli1a (endothelial cells, magenta), PCNA (proliferation marker, green), and DNA (DAPI, blue). Arrowheads point to PCNA+ cECs. D. Percentage of PCNA+ cECs in the border zone of cxcr1+/+ (n=4) and cxcr1−/− (n=4) ventricles at 96 hpci. E. Wholemount images of ventricles of Tg(−0.8flt1:RFP); cxcr1+/+ (E’) and Tg(−0.8flt1:RFP); cxcr1−/− (E”) sibling zebrafish at 7 dpci. F. Percentage of RFP fluorescence intensity in the injured tissue of Tg(−0.8flt1:RFP); cxcr1+/+ (n=3) and Tg(−0.8flt1:RFP); cxcr1−/− (n=3) ventricles at 7 dpci. G. AFOG staining of sections of cxcr1+/+ (G’) and cxcr1−/− (G”) ventricles at 90 dpci. Orange, Muscle; red, Fibrin; blue, Collagen. H. Percentage of scar area relative to ventricular area in cxcr1+/+ (n=4) and cxcr1−/− (n=4) ventricles at 90 dpci. Black (A,G), white (C) and orange (E) dotted lines delineate the injured tissue. Statistical tests: Non-parametric Mann-Whitney test (B), Student’s t-test (D,F,H). Scale Bars: 200 μm (A,E,G), 100 μm (C). Ct values of RT-qPCR data are listed in table S3.