
Figure 2. Technical variability is reduced when peptide measurements are combined to a protein measurement.
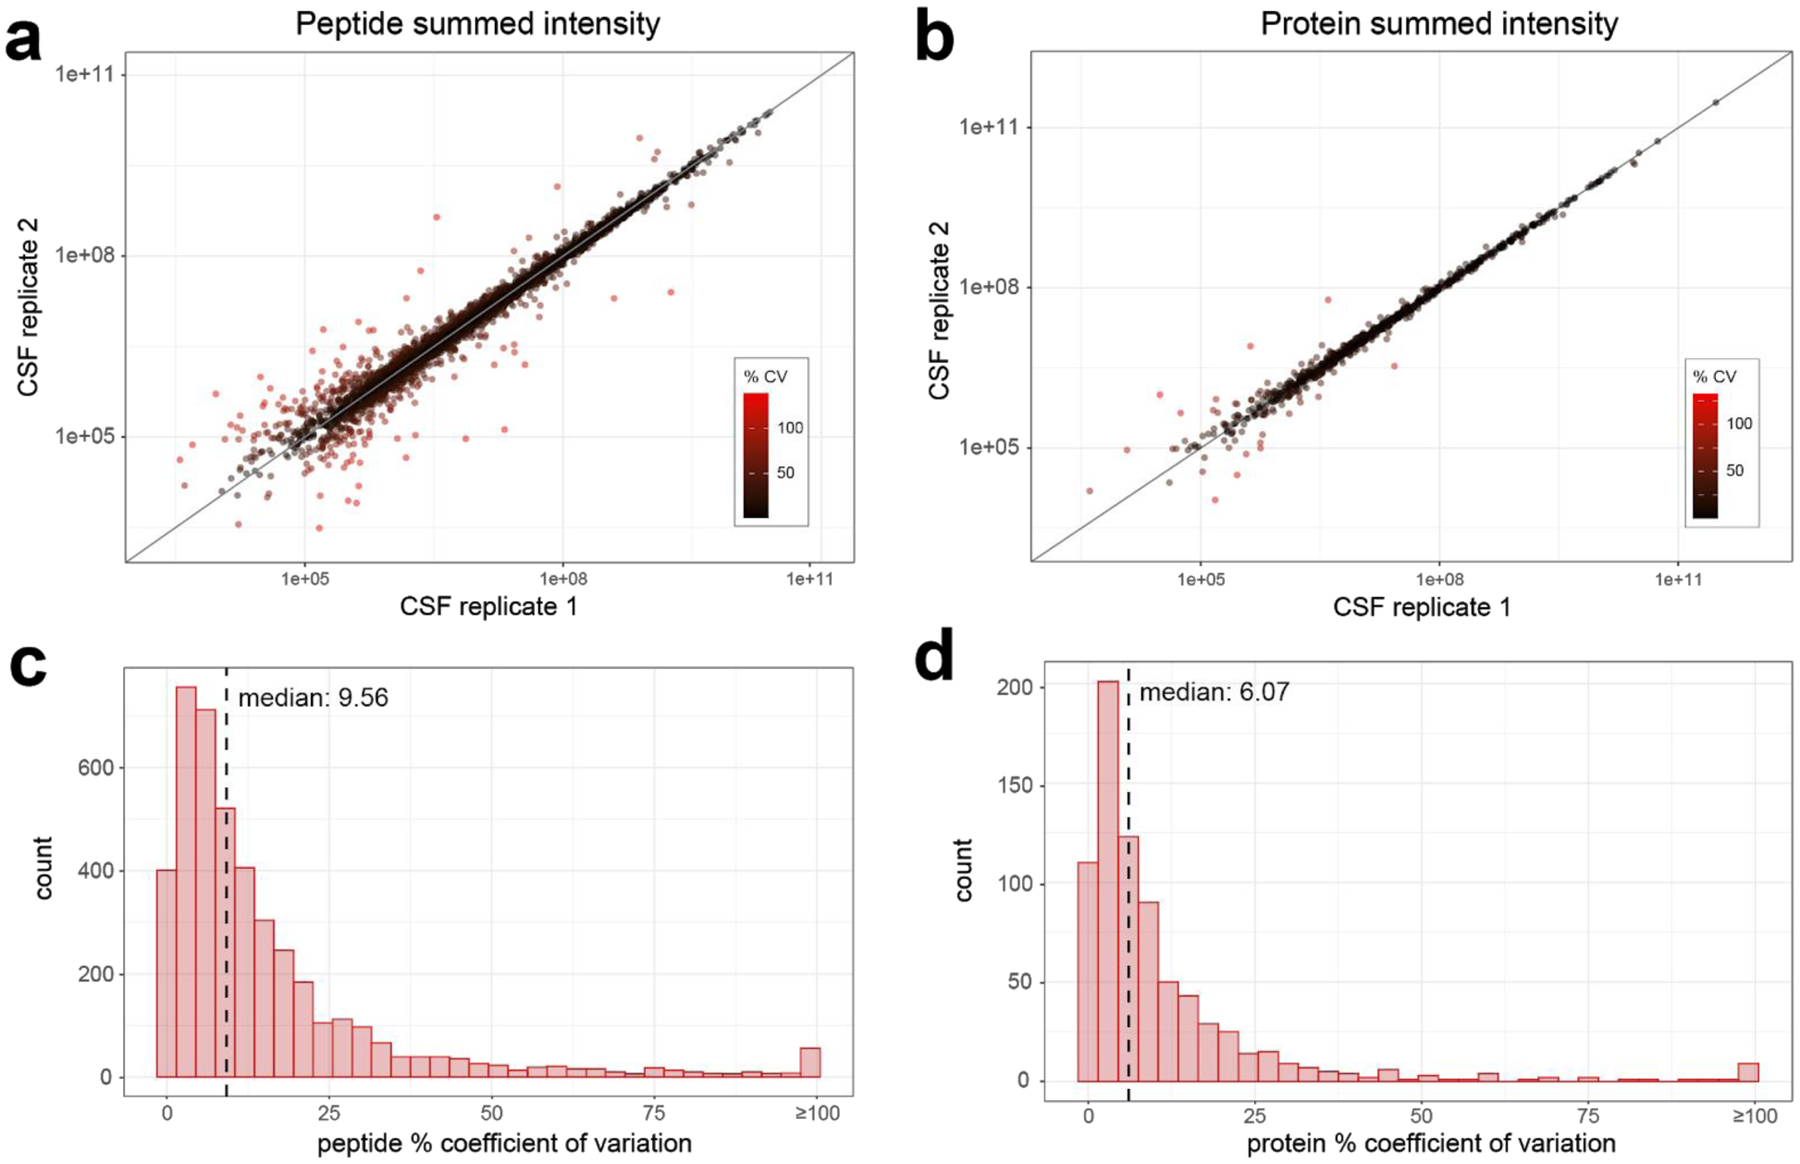
A human cerebrospinal fluid sample digest was analyzed by DIA-MS with 8 m/z staggered windows (4 m/z after demultiplexing). The relationship between a) peptide quantities, or b) summed protein quantities across two replicate instrument runs are plotted, with each peptide colored according to calculated percent coefficient of variation. The distribution of % coefficient of variation for c) peptides and d) summed protein quantities between replicate instrument runs, with the median % coefficient of variation for each indicated by the dashed line.