
Figure 4. Differential abundance profiles of tryptic peptides mapping to amyloid precursor protein.
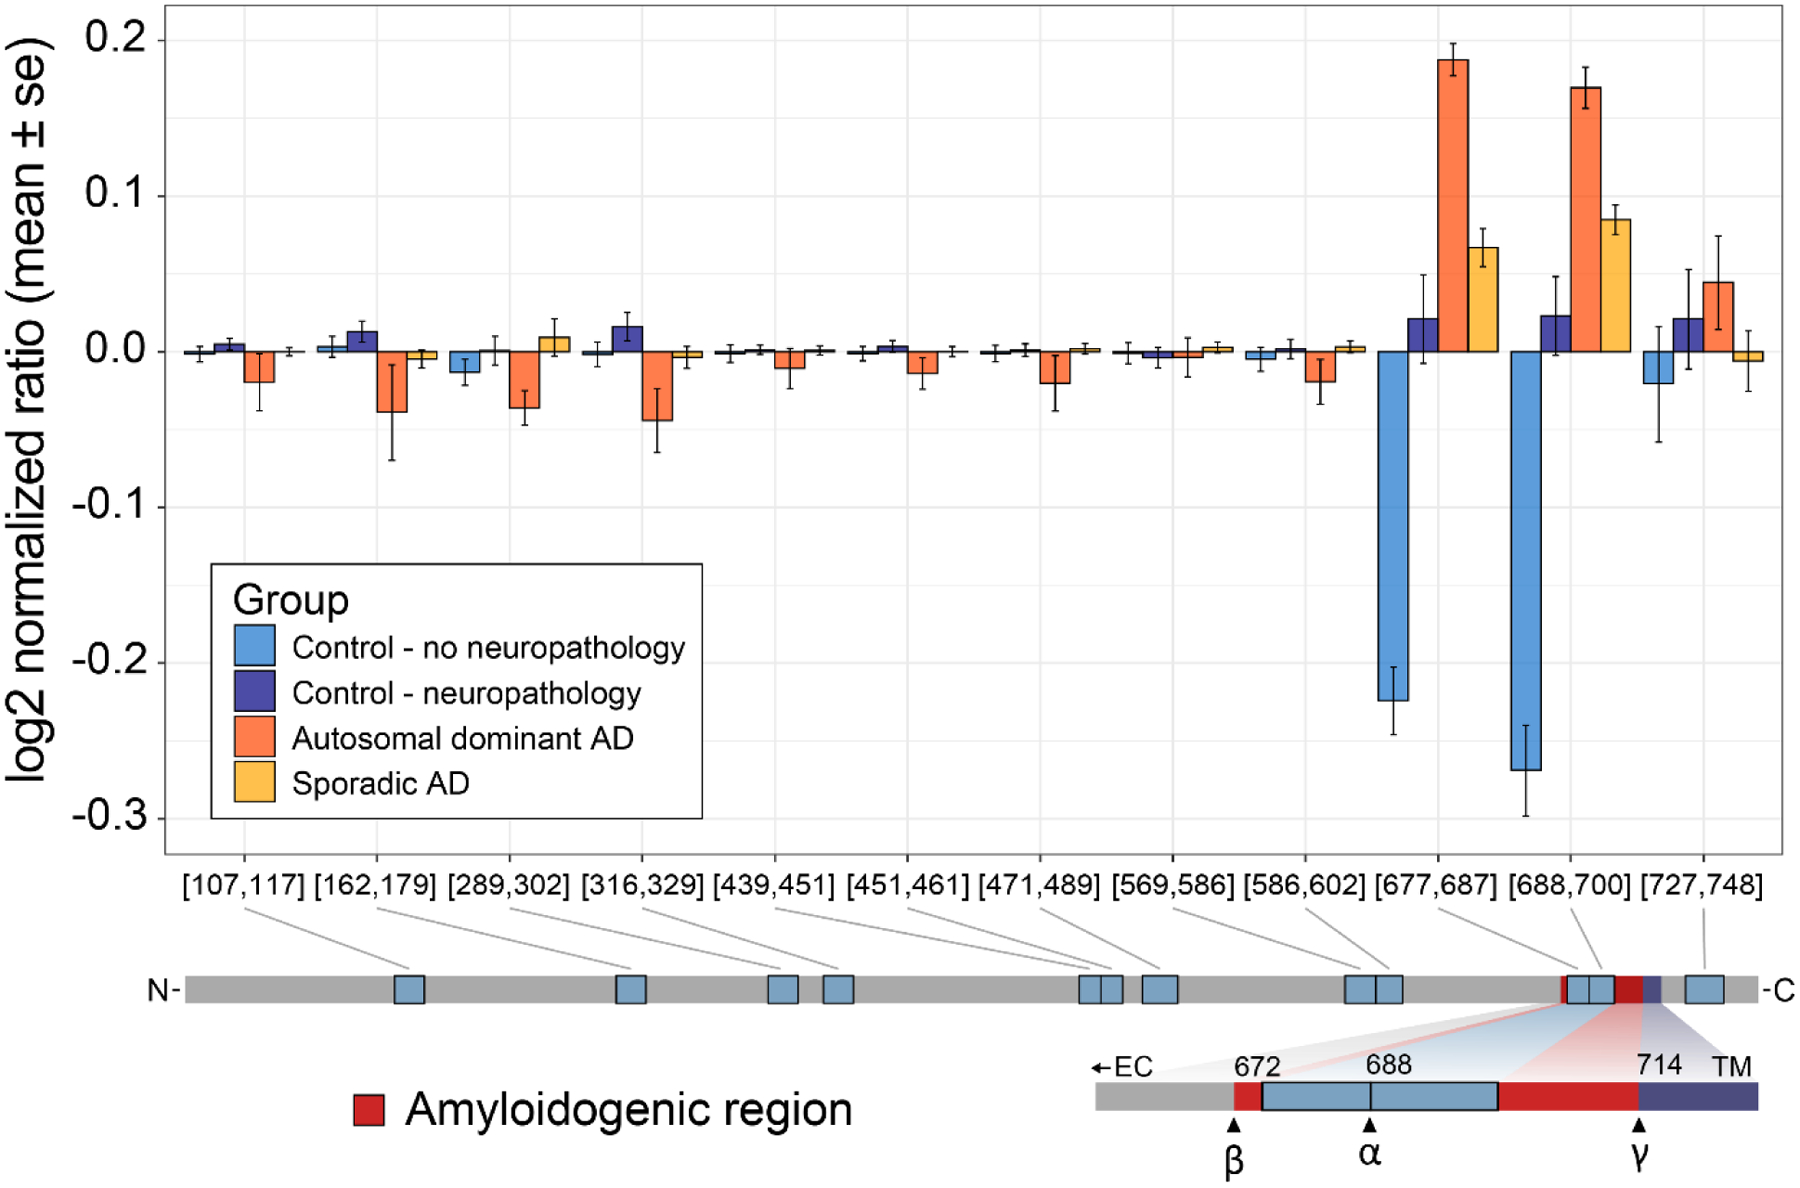
Hippocampus tissue from four experimental groups of patients were analyzed by DIA-MS; Control/No Neuropath with normal cognitive function and no neuropathologic changes of Alzheimer’s disease including no amyloid accumulation, Control/Neuropath with normal cognitive function and intermediate or severe level of neuropathologic changes of Alzheimer’s disease, Sporadic AD with dementia and intermediate or severe level of neuropathologic changes of Alzheimer’s disease, and Autosomal dominant AD with dementia and intermediate or severe level of neuropathologic changes and an autosomal dominant mutation. For all unique peptides mapping to the amyloid precursor protein sequence, peptide measures are normalized to the mean and the mean & standard error are plotted by group. Based on known protein processing we see that the two peptides with large differences map to the amyloidogenic Aβ polypeptide.