. 2022 Feb 21;10(4):468–481. doi: 10.1158/2326-6066.CIR-21-0369

Figure 2.

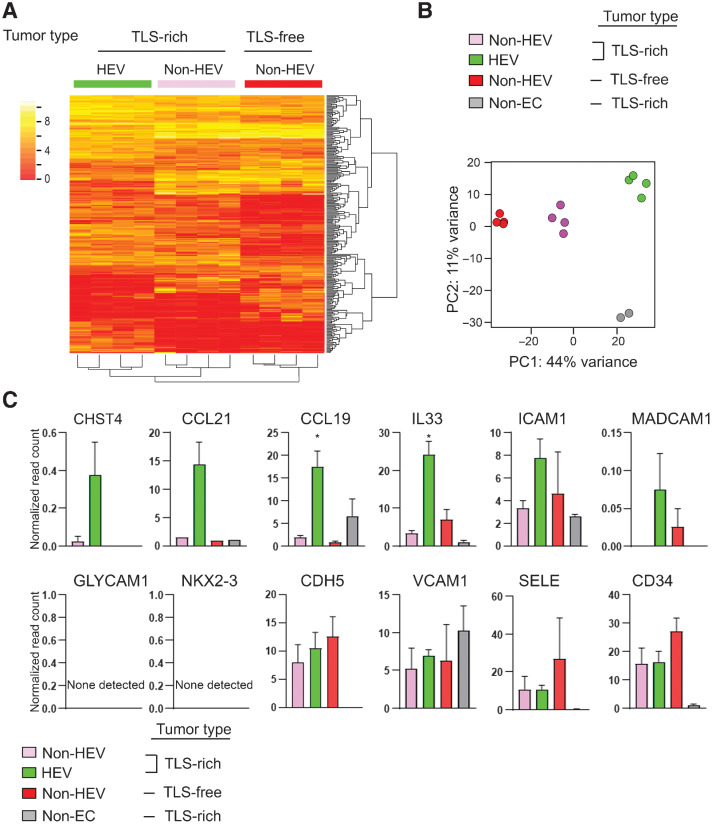
Figure 2. Comparative transcriptome analysis of HEV vs. non-HEV tumor vessels. Tumors of four breast cancer patients exhibiting abundant TLS (TLS-rich tumors) and four exhibiting no TLS (TLS-free tumors) were examined. TLS-rich tumors were stained for MECA-79 to identify ECs of HEVs, and these ECs were isolated by laser-capture microdissection. ECs of non-HEV vessels were identified by CD31 staining in the HEV-free areas of each tumor type and isolated by laser-capture microdissection. RNA-seq was conducted for all three types of ECs. Non-EC: the areas outside of HEVs (mostly containing lymphocytes of TLS) were also examined in the same way to evaluate potential cell contamination during the laser-capture microdissection process. A, A heat map of the top 1,000 differentially expressed genes between the three different types of ECs. B, PCA shows clear separations of gene-expression patterns between different EC types as well as TLS lymphocytes (non-EC cells). C, Expression patterns of known HEV-associated genes in different EC types. Y-axis, normalized read count × 1/100. Data are presented as means ± SEM. *, P < 0.05.

Comparative transcriptome analysis of HEV vs. non-HEV tumor vessels. Tumors of four breast cancer patients exhibiting abundant TLS (TLS-rich tumors) and four exhibiting no TLS (TLS-free tumors) were examined. TLS-rich tumors were stained for MECA-79 to identify ECs of HEVs, and these ECs were isolated by laser-capture microdissection. ECs of non-HEV vessels were identified by CD31 staining in the HEV-free areas of each tumor type and isolated by laser-capture microdissection. RNA-seq was conducted for all three types of ECs. Non-EC: the areas outside of HEVs (mostly containing lymphocytes of TLS) were also examined in the same way to evaluate potential cell contamination during the laser-capture microdissection process. A, A heat map of the top 1,000 differentially expressed genes between the three different types of ECs. B, PCA shows clear separations of gene-expression patterns between different EC types as well as TLS lymphocytes (non-EC cells). C, Expression patterns of known HEV-associated genes in different EC types. Y-axis, normalized read count × 1/100. Data are presented as means ± SEM. *, P < 0.05.