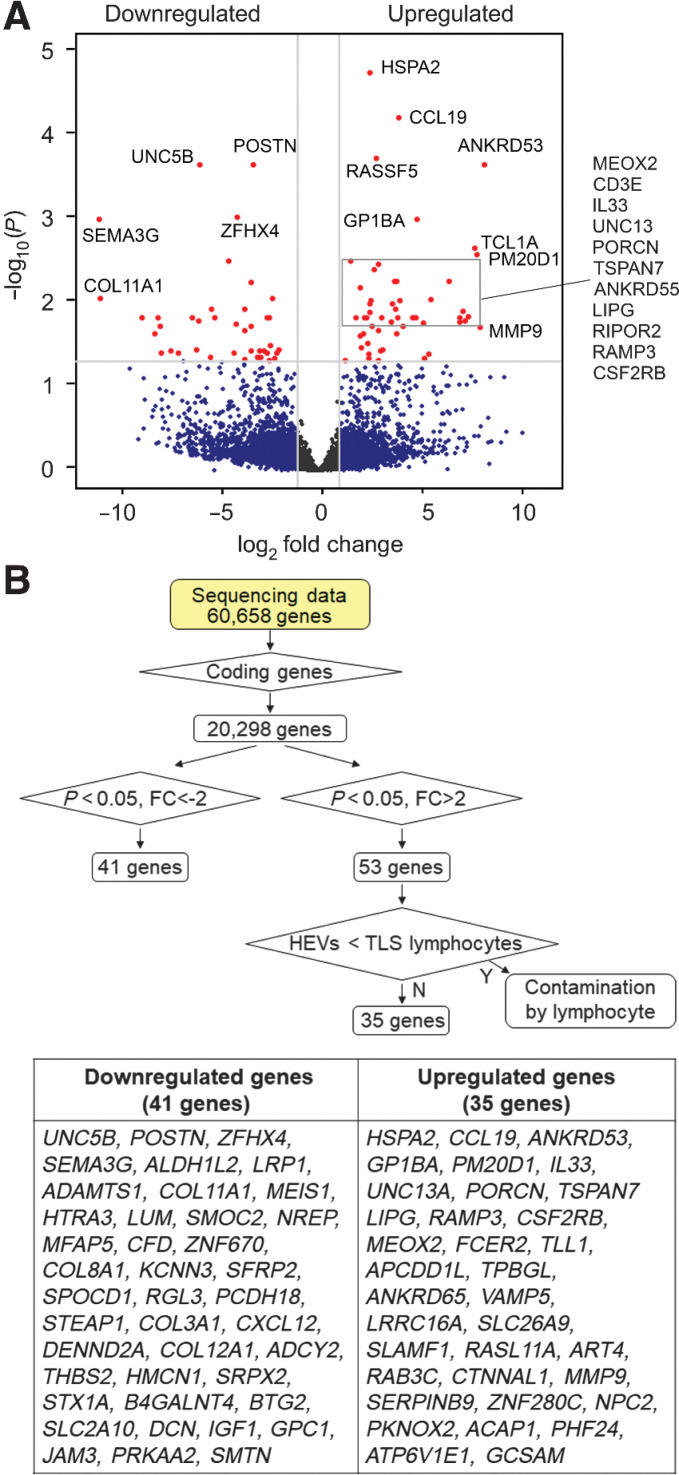
Figure 3.
Gene-expression signature of intratumoral HEVs. The RNA-seq data generated as outlined for Fig. 2 were further analyzed to identify differentially expressed genes. A, Volcano plot of >2-fold upregulated or downregulated genes in ECs of intratumoral HEVs compared with non-HEV blood vessels of TLS-rich and TLS-free tumors combined. Red dots, genes with adjusted P values (Padj) < 0.05. B, Flowchart of RNA-seq data processing for the identification of differentially upregulated or suppressed genes and a list of 35 upregulated and 41 downregulated genes in intratumoral HEVs compared with non-HEV tumor vessels. FC, fold change; Y, Yes; N, No.

