. 2022 Feb 21;10(4):468–481. doi: 10.1158/2326-6066.CIR-21-0369

Figure 4.

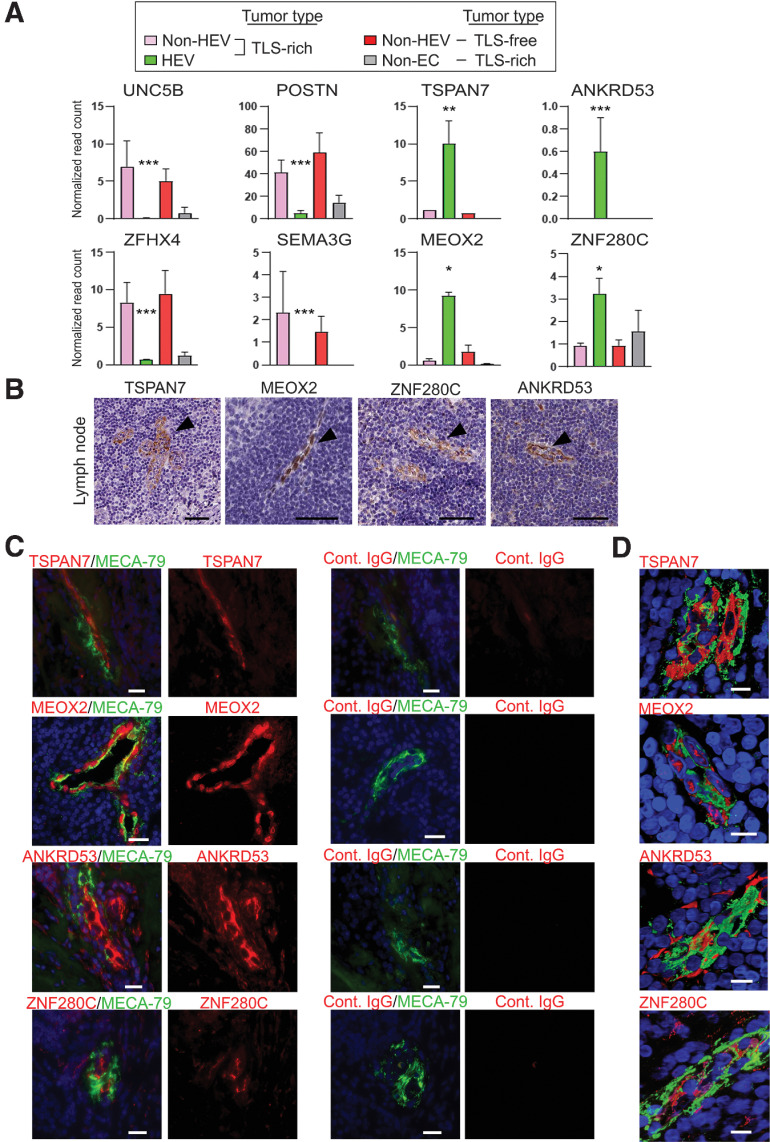
Figure 4. Unique gene-expression pattern of intratumoral HEVs. A, Normalized read counts of eight individual genes are shown. The data were generated using the RNA-seq data generated as outlined for Fig. 2. Adjusted P values for the comparison between the three tumor vessel types (n = 4 for each EC type, n = 2 for non-EC). Y-axis, normalized read count × 1/100. Data are presented as means ± SEM. *, Padj < 0.05; **, Padj < 0.01; ***, Padj < 0.001; error bar: SEM. B, Expression of the proteins encoded by the four genes in A in human lymph nodes is shown in the images obtained from the Human Protein Atlas. Arrowheads, lymph node HEVs. Scale bar, 50 µm. C, Immunofluorescence staining of breast cancer TLS to validate the protein expression of four genes that were found upregulated in intratumoral HEVs by RNA-seq analysis (A). MECA-79 (green), TSPAN7, MEOX2, ANKRD53, or ZNF280C (red), Hoechst nuclear staining (blue). MECA-79+ vessels stained with each isotype-matched control IgG are shown on the right. Ten tumor sections were examined. Scale bar, 50 µm. D, Confocal microscopy to analyze costaining of HEVs with MECA-79 (green) and TSPAN7, MEOX2, ANKRD53, or ZNF280C (red) in 3-D images reconstructed from ≥ 45 Z-sections. Hoechst (blue). MEOX2 is a transcription factor and shows nuclear staining. Scale bar, 10 µm.

Unique gene-expression pattern of intratumoral HEVs. A, Normalized read counts of eight individual genes are shown. The data were generated using the RNA-seq data generated as outlined for Fig. 2. Adjusted P values for the comparison between the three tumor vessel types (n = 4 for each EC type, n = 2 for non-EC). Y-axis, normalized read count × 1/100. Data are presented as means ± SEM. *, Padj < 0.05; **, Padj < 0.01; ***, Padj < 0.001; error bar: SEM. B, Expression of the proteins encoded by the four genes in A in human lymph nodes is shown in the images obtained from the Human Protein Atlas. Arrowheads, lymph node HEVs. Scale bar, 50 µm. C, Immunofluorescence staining of breast cancer TLS to validate the protein expression of four genes that were found upregulated in intratumoral HEVs by RNA-seq analysis (A). MECA-79 (green), TSPAN7, MEOX2, ANKRD53, or ZNF280C (red), Hoechst nuclear staining (blue). MECA-79+ vessels stained with each isotype-matched control IgG are shown on the right. Ten tumor sections were examined. Scale bar, 50 µm. D, Confocal microscopy to analyze costaining of HEVs with MECA-79 (green) and TSPAN7, MEOX2, ANKRD53, or ZNF280C (red) in 3-D images reconstructed from ≥45 Z-sections. Hoechst (blue). MEOX2 is a transcription factor and shows nuclear staining. Scale bar, 10 µm.