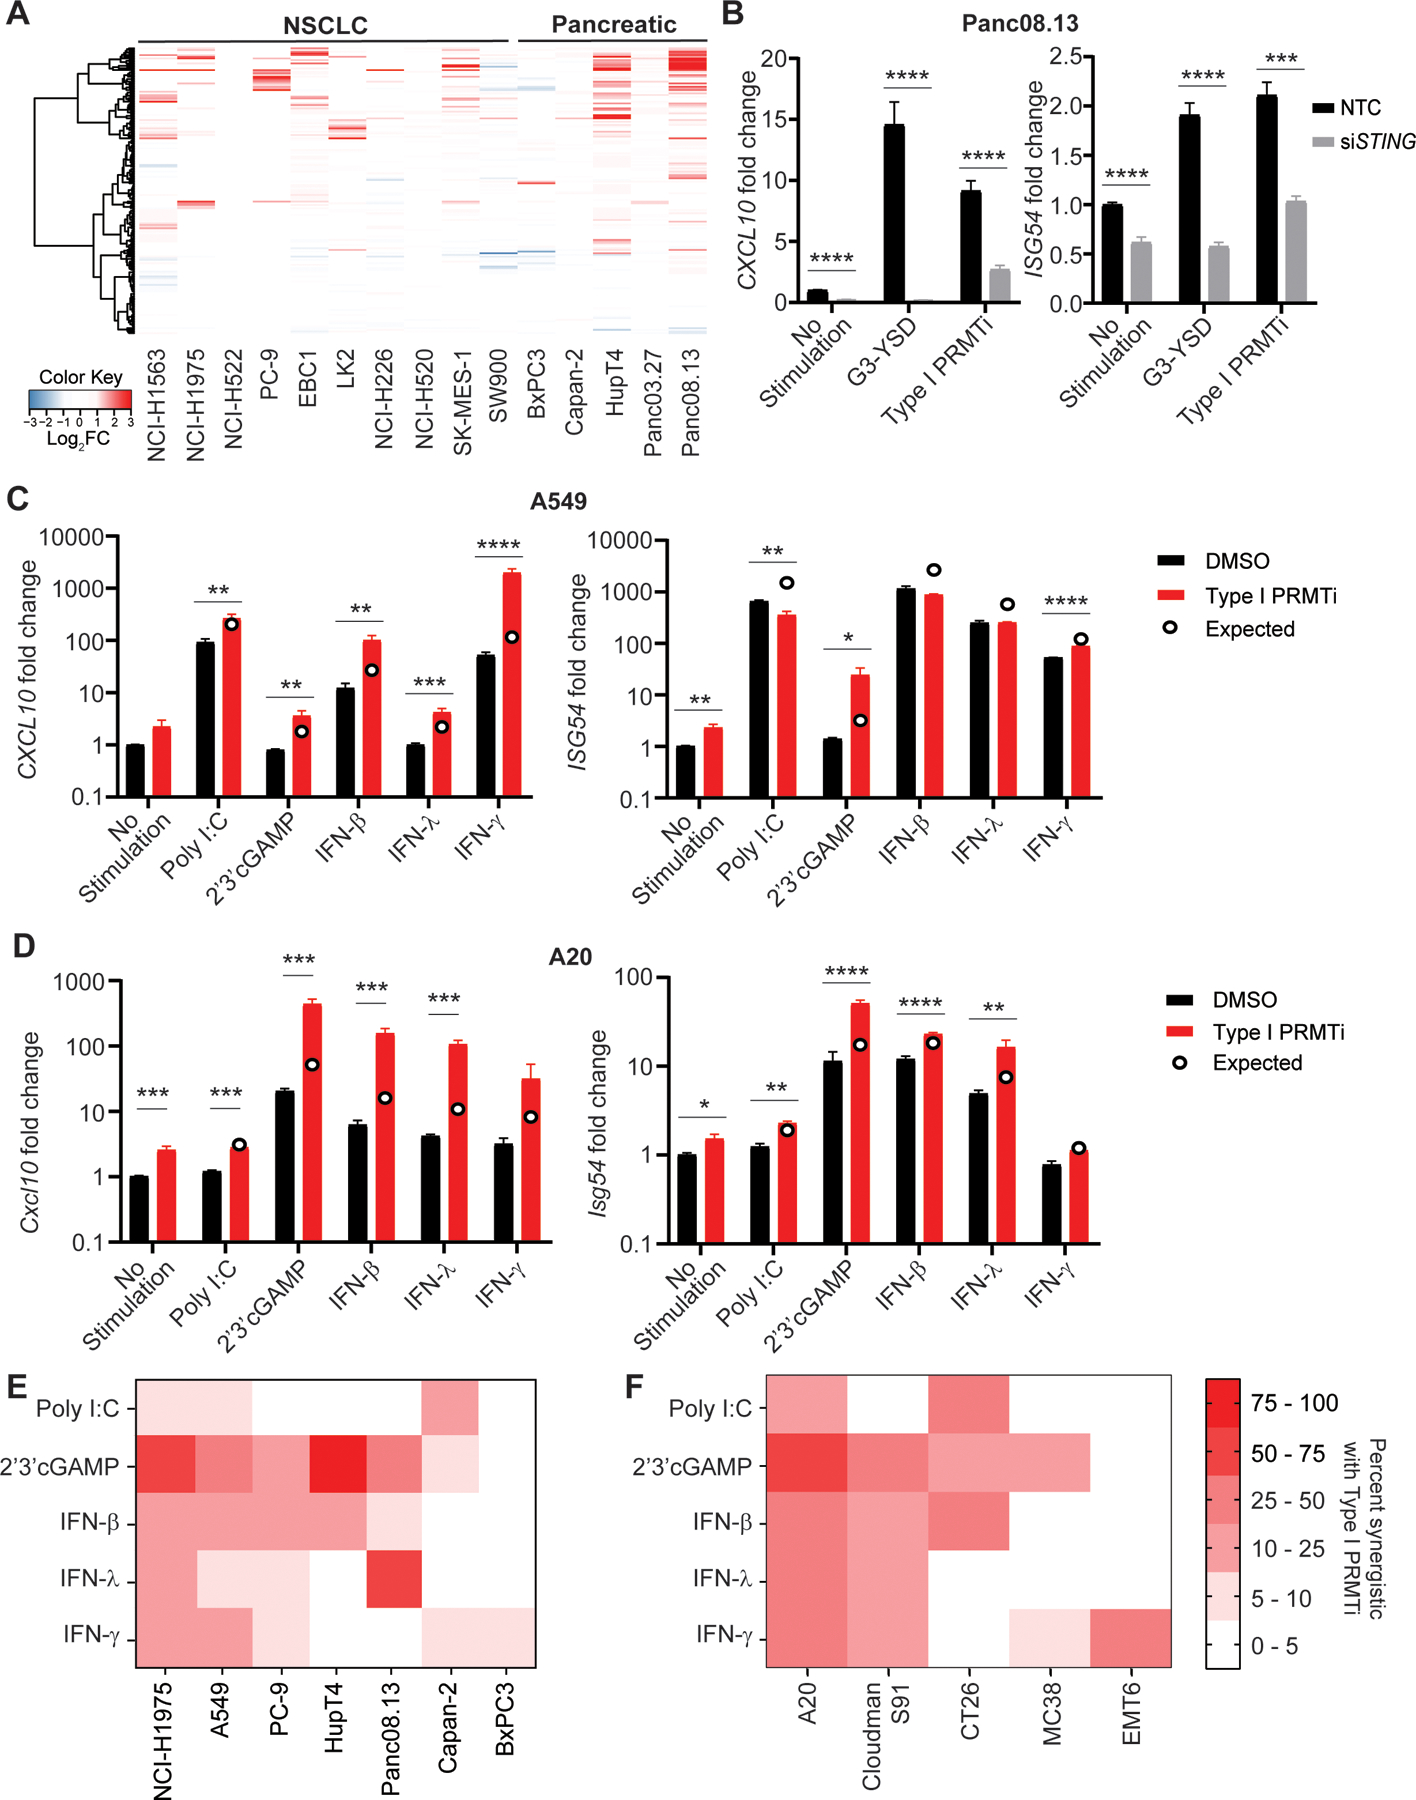
Fig. 2: Induction of interferon stimulated genes (ISGs) in cancer cell lines with Type I PRMT inhibition.

A, Heatmap of genes in the IFNγ response pathway in the indicated tumor cell lines with/without Type I PRMTi treatment. Tumor cells were treated with 0.1% DMSO or 2 μM Type I PRMTi for 4 days. RNA-seq was used to determine gene expression. Log2-fold differential expression of genes was plotted. B, Human Panc08.13 pancreatic tumor cells were transfected with either pooled non-targeting control (NTC) or pooled STING-specific siRNAs (siSTING), and transfected cells were then treated with either 0.1% DMSO or 2 μM Type I PRMTi for 6 days. Treatment with 24 hours of cGAS (G3-YSD, 500 ng/mL) agonist was served as positive control. qRT-PCR was used to determine the expression of CXCL10 or ISG54 in treated tumor cells (N≥2). C-D, Type I PRMTi, PRR agonists, and interferon effects on CXCL10 and ISG54 expression in tumor cells. (C) Human A549 lung cancer cells and (D) mouse A20 lymphoma cells were treated with 0.1% DMSO or 2 μM Type I PRMTi for 6 days with/without 24-hour exposure to PRR agonists or interferons. qRT-PCR was used to determine the expression of CXCL10 and ISG54 in treated tumor cells (N≥2). Open circles: predicted additive effect of the combination treatment. E-F, Heatmap of percentage of ISGs’ synergistic effects with Type I PRMTi and PRR agonists or interferons in a panel of (E) human and (F) mouse cell lines. Cells were treated with 0.1% DMSO or 2 μM Type I PRMTi for 6 days with/without 24-hour exposure to PRR agonists or interferons. The percentages of ISGs synergistic for the combination of Type I PRMTi with individual PRR agonist were calculated based on the expression of ISGs induced by the indicated treatment. All data are presented as mean±SEM. N indicates number of biological replicates for each group. Three technical replicates were performed for each biological replicate. P values were calculated by student’s 2-tailed t-test; *p≤0.05, **p≤0.01; ***p≤0.001; ****p≤0.0001.
