
Figure 4.
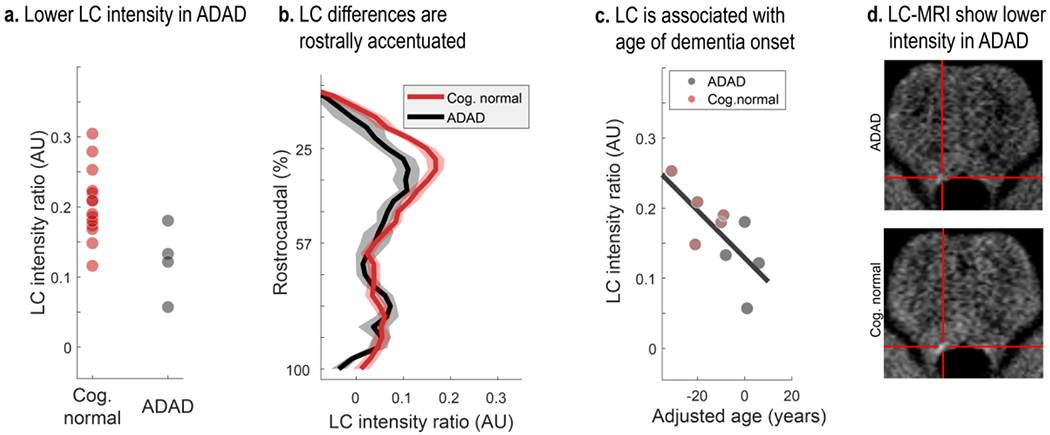
Lower LC intensity ratios in autosomal-dominant Alzheimer’s disease (ADAD). Cognitively normal (n = 14) participants are compared against mutation carriers that show cognitive impairments based on the Washington University Clinical Dementia Rating Scale (i.e., CDR > 0; n = 4). a. Symptomatic participants show lower overall LC intensity ratios relative to cognitively normal controls (Z = −2.177; p = 0.03). b. Group differences are most pronounced in middle–rostral segments of the LC (plotted on the y-axis; Z = −2.816; p = 0.005; shaded areas indicate ± 1 standard error of the mean [SEM]). c. Closer proximity to the mutation-specific median age of dementia diagnosis (adjusted age) is associated with lower overall LC ratios (mean correlation coefficient across 1,000,000 bootstraps: rho = −0.671; p = 0.024). Note that in panel c only confirmed mutation carriers (n = 9) with and without cognitive symptoms are included (black and red markers, respectively). d. LC-MRI of cognitively normal and symptomatic participants (four per group) were standardized and averaged. The crosshair highlights lower LC intensity in symptomatic participants. LC, locus coeruleus; Cog. normal, cognitively unimpaired participants.