
Figure 5.
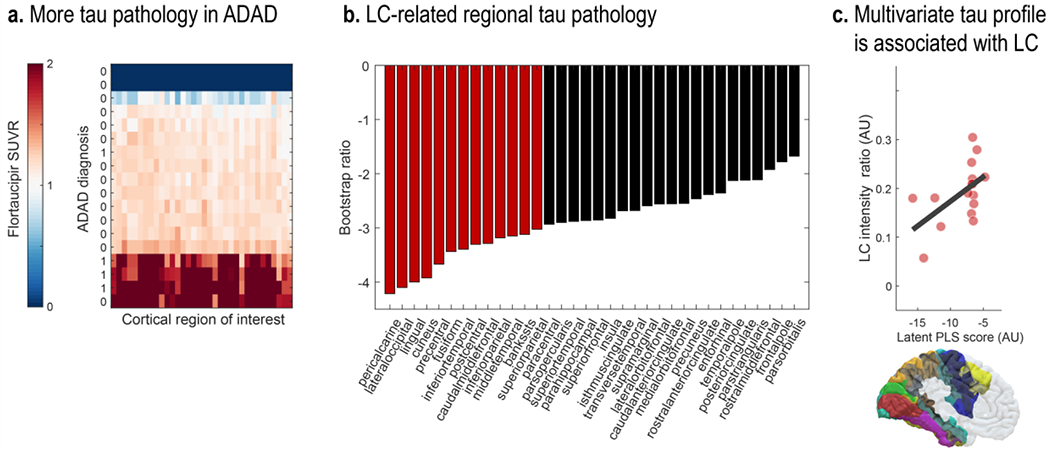
Lower LC intensity is associated with tau burden in posterior brain regions. a. Symptomatic participants show higher flortaucipir standardized uptake value ratios (SUVR) across most cortical regions relative to cognitively normal controls (missing PET data for two participants [dark blue bars]). b. Contribution of individual cortical regions of interest to a partial least squares (PLS) latent variable indexing LC-related tau pathology (Bootstrap ratios < −3 are considered reliable). c. Scatter plot depicting the relation between latent PLS scores and LC intensity (p = 0.037; r = 0.54 [95% CI: 0.167, 0.806]). LC, locus coeruleus; ADAD, autosomal-dominant Alzheimer’s disease.