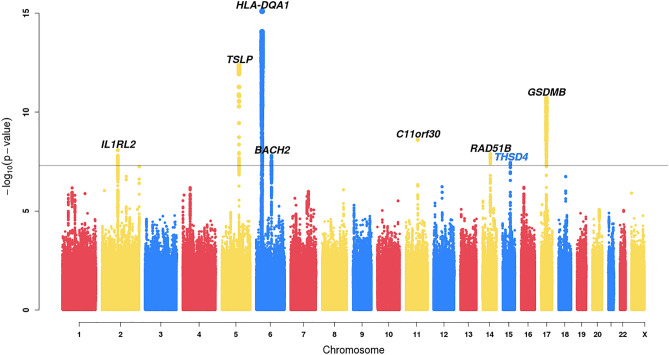
Figure 1.
Manhattan plot of common variants (MAF > 1%) associated with asthma risk in this GWAS of 3,181 moderate-to-severe asthma patients and 3590 non-asthma controls. The −log10 two-sided p-values are displayed. Variants with P < 0.01 for the differential effects test (See “Methods”) are filtered out. See Supplemental Fig. S2 for a corresponding plot which includes all variants. The black line indicates the genome-wide significance threshold of 5 × 10⁻⁸. Previously reported loci are labeled in black, the novel locus is labeled in blue.

