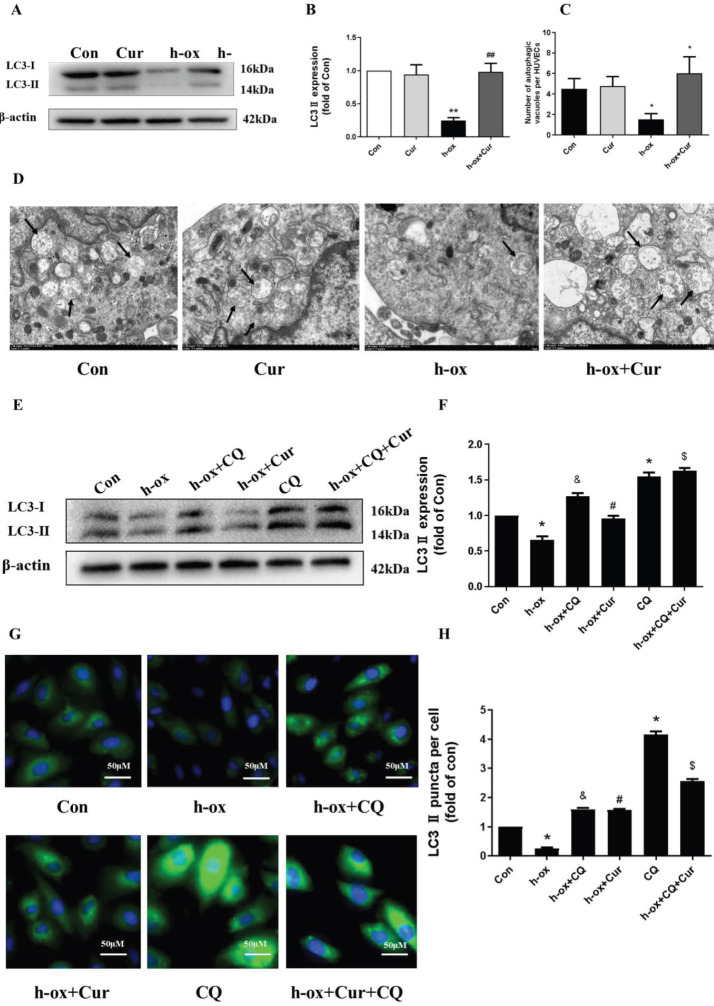
Figure 5.
Curcumin ameliorated high ox-LDL-induced inhibition of autophagy in HUVECs. A and B: The protein expression levels of LC3-II were measured by Western blotting. LC3-II expression was quantified by densitometry using ImageJ software (n=3). C and D: Ultrastructural images of autophagic vacuoles (black arrows) in HUVECs (n=3). E and F: The protein expression levels of LC3-II were measured by Western blotting, and CQ was added 8 h before the assessment of autophagic flux. LC3-II expression was quantified by densitometry using ImageJ software (n=3). G and H: Immunofluorescence staining of LC3. Expression was quantified using ImageJ software (n=3). Autophagic vesicle accumulation was quantitated using ImageJ software and is expressed as the number of autophagic vesicles per cell. The data are shown as the means±SDs (* P< 0.05 vs. the control group; ** P<0.01 vs. the control group; # P<0.05 vs. the high ox-LDL group; ## P<0.05 vs. the high ox-LDL group; & P<0.05 vs. the CQ group; $ P<0.05 vs. the high ox-LDL +curcumin group)

