
Figure 2.
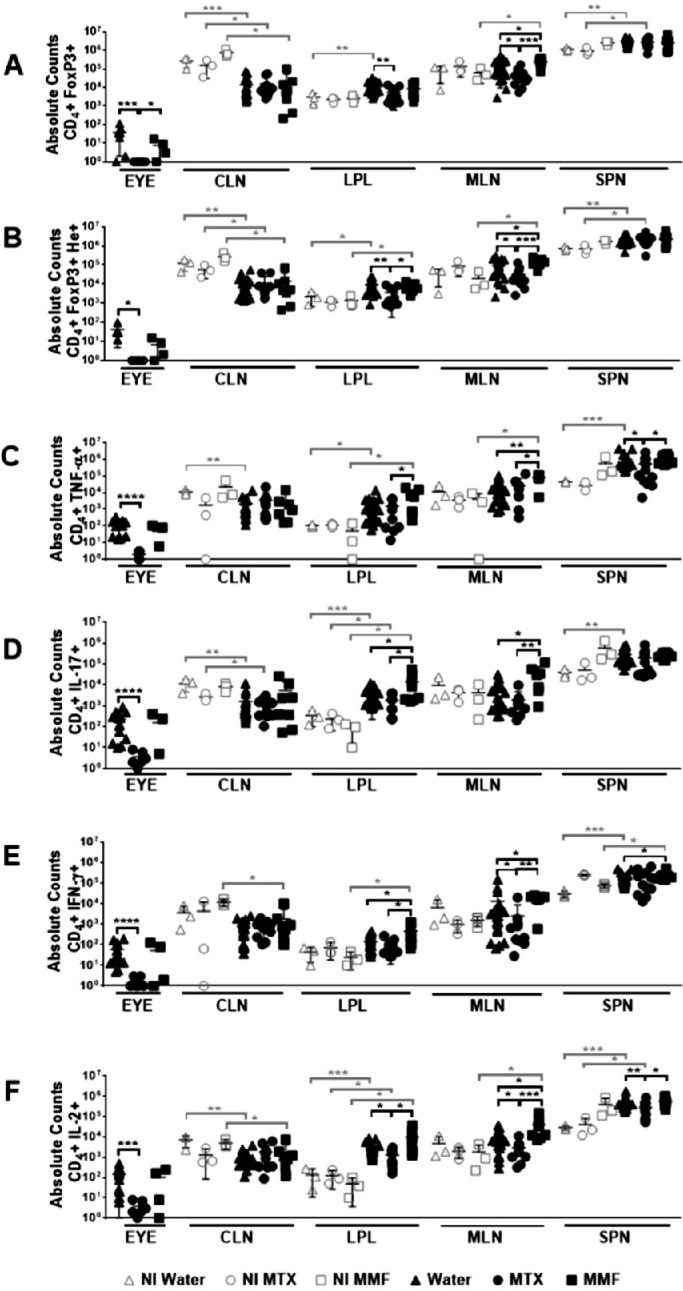
Absolute counts of T regulatory (A, B) and T effector (C, D, E, F) lymphocyte subpopulations in different tissues after antimetabolite treatment in experimental autoimmune uveitis and non-immunized controls. CLN, cervical lymph nodes; LPL, gut lamina propria; MLN, mesenteric lymph node; SPN, spleen; NI, non-immunized; Water, control group; MTX, methotrexate treated mice; MMF, mofetil mycophenolate treated mice. *P < 0.05, **P < 0.01, ***P < 0.001, ****P < 0.0001. Data expressed as mean ± standard deviation; n = 3 mice per group (non-immunized), and 5 to 20 mice per group (immunized). Time-point = 6 weeks post-treatment initiation, 2 weeks post-immunization.