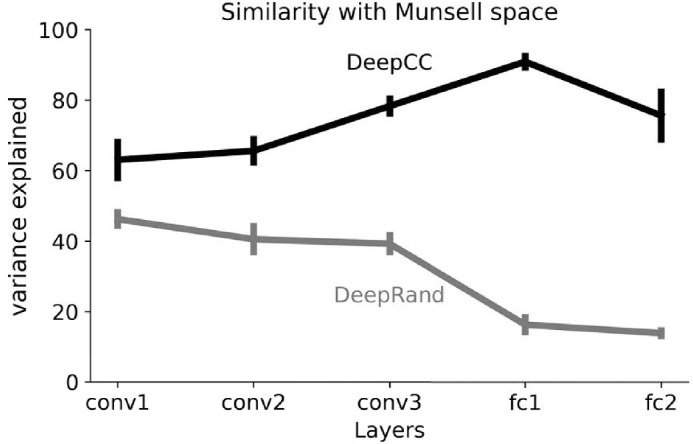
Figure 8.

Result of the similarity analysis for all layers of the deep architecture trained on the CC dataset (DeepCC) and with random weights (DeepRand), from convolutional layer 1 (conv1) to fully connected layer 2 (fc2). The figure shows that the highest similarity with Munsell coordinates was found for DeepCC at the first fully connected layer fc1. Additionally, DeepCC always rates higher than DeepRand.
