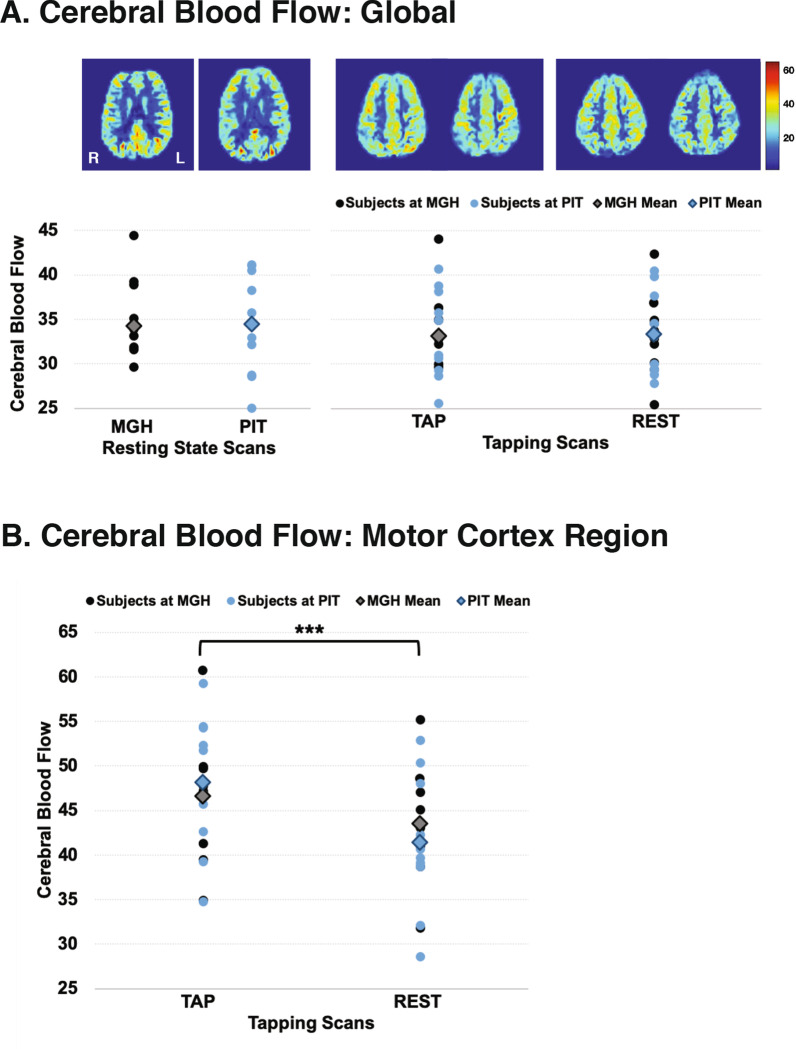
Fig. 4.
Global and regional cerebral blood flow (CBF) measured at the two scanning locations. Mean CBF maps for each subject at each location for resting state scans (a) and for finger-tapping scans (b). CBF maps for the finger-tapping scans are shown separately for the tapping and resting portions of the scans. Mean global CBF and regional flow values in the motor cortex compared with paired-samples t-tests (c) were not significantly different between the two scanning locations for the resting state scans or for the tapping and resting portions of the finger-tapping scans

