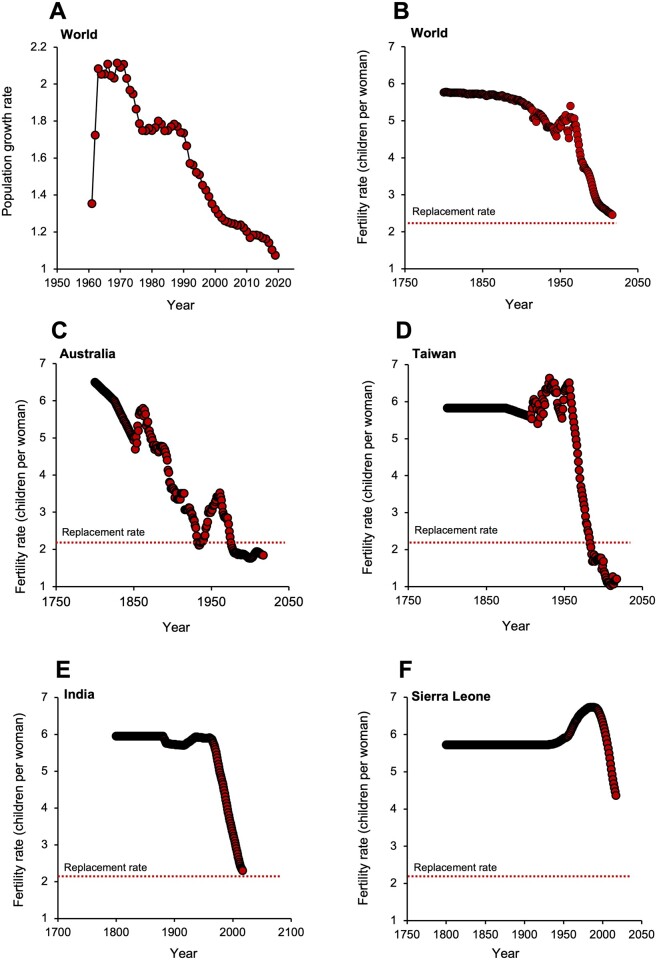
Figure 1.
Human population dynamics. (A) Changes in the rate of population growth. In the early 1960s, population growth rates approximated to 2.1% per annum. However, beginning in 1970 global population growth rates slowed dramatically and are now just over 1% per annum. Source: http://datacatalog.worldbank.org/ (4 October 2021, date last accessed). (B) Changes in global total fertility rate (TFR) over time; TFR is defined as the number of children born per woman over her lifetime, while replacement rate is defined as 2.1 children per woman. (C) Changes in TFR against time in Australia. (D) Changes in TFR against time in Taiwan as an exemplar of the Tiger economies of SE Asia. (E) Changes in TFR against time in India. (F) Changes in TFR against time in Sierra Leone as an exemplar of sub-Saharan Africa. Source: United Nations—Population Division (2019 revision) accessed via http://ourworldindata.org/fertility-rate. CC-BY (28 September 2021, date last accessed).

