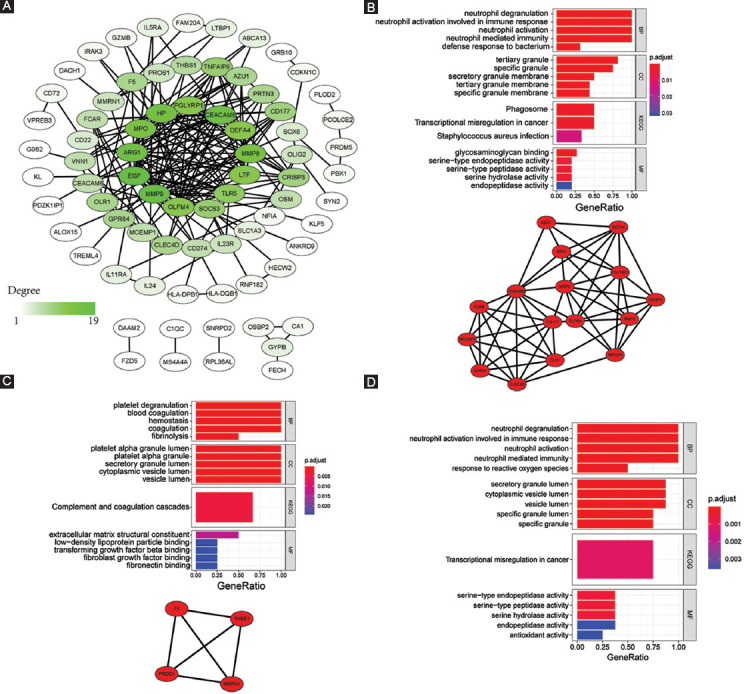
FIGURE 3.

PPI network. (A) Overview of PPI network of DEGs in SJIA patients and healthy controls. Color darkness intensity represents gene connectivity. (B) PPI network and GO/KEGG analysis of gene set of module A. (C) PPI network and GO/KEGG analysis of gene set of module B. (D) GO/KEGG analysis of the hub gene set. BP: Biological process; CC: Cellular component; MF: Molecular function; KEGG: Kyoto Encyclopedia of Genes and Genomes; PPI: Protein-protein interaction; DEG: Differentially expressed gene; SJIA: Systemic juvenile idiopathic arthritis; GO: Gene ontology.
