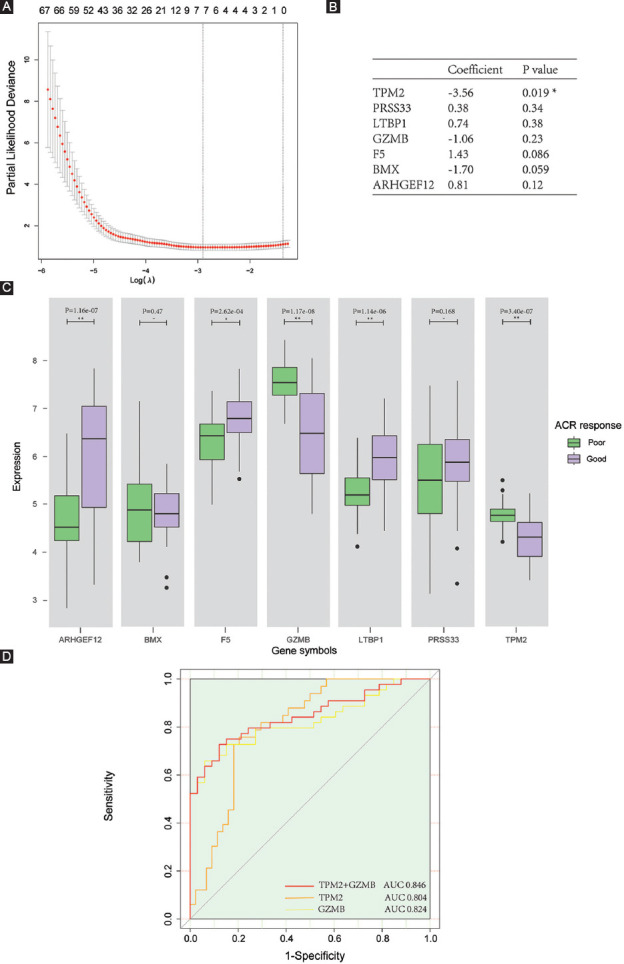
FIGURE 4.

Prognostic markers screening and testing. (A) Partial likelihood deviance plot for LASSO regression analysis. (B) Binary logistic regression model with most potential genes. (C) Different expression patterns compared between two response types. (D) ROC curve for testing prognostic value. ACR: American College of Rheumatology.
