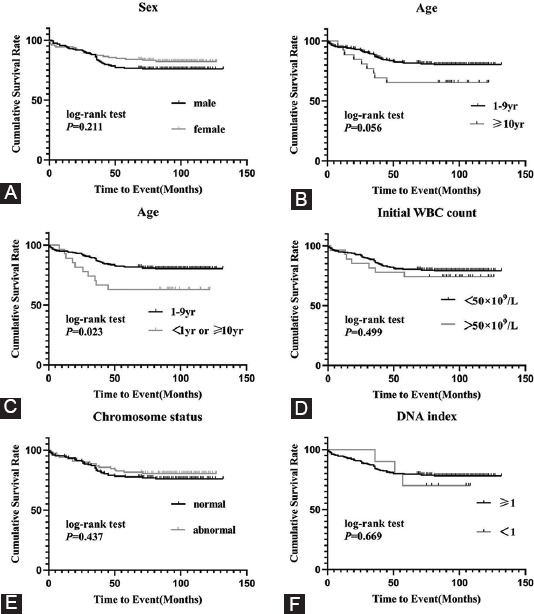
FIGURE 3.

Relationships of traditional risk factors and prognosis. (A) pEFS rates between male patients and female patients groups: pEFS rates in males and females were 75.9 ± 3.4% and 82.1 ± 3.5% (p = 0.211). (B) pEFS rates between different age at diagnosis(excluding <1 year): pEFS rates in ≥10 year and 1-9 year groups were 65.4 ± 9.3% and 80.3 ± 2.5% (p = 0.056) (C) pEFS rates between different age at diagnosis(including <1 year): pEFS rates in <1 year + ≥10 year and 1-9 year groups were 63.0 ± 9.3% and 80.3 ± 2.5% (p = 0.023). (D) pEFS rates between different initial WBC count level: pEFS rates in WBC count <50 × 109/L and ≥50 × 109/L groups were 80.3 ± 2.5% and 65.4 ± 9.3% (p = 0.499). E: pEFS rates between different chromosome status: pEFS rates in normal and abnormal chromosomal karyotype groups were 76.0 ± 3.5% and 80.4 ± 4.0% (p = 0.437). F: pEFS rates between different DNA index: pEFS rates in DNA index ≥1 and <1 groups were 78.1 ± 2.7% and 70 ± 14.5% (p = 0.669).
