
FIGURE 4.
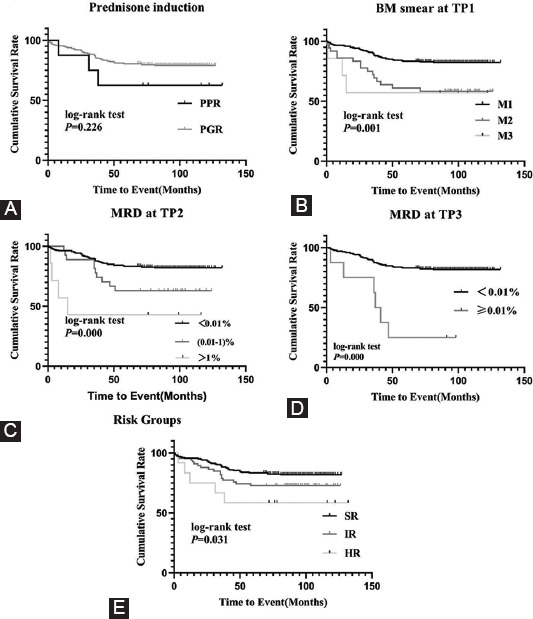
Outcome relationships of treatment response and risk groups. (A) pEFS rates between PGR and PPR patient groups: pEFS rates in PGR and PPR patient groups were 79.1 ± 2.5% and 62.5 ± 17.1% (p = 0.226). (B) pEFS rates between M1, M2 and M3 groups at TP1: pEFS rates in M1, M2 and M3 groups TP1 were 82.4 ± 2.5%, 60.0 ± 8.3% and 57.1 ± 18.7% (p = 0.001). (C) pEFS rates between different MRD level at TP2: pEFS rates in MRD <0.01 × 10⁻², 0.01-1 × 10⁻² and ≥1 × 10⁻² groups at TP2 were 82.0 ± 2.5%, 63.0 ± 9.3% and 42.9 ± 18.7% (p < 0.001). (D) pEFS rates between different MRD level at TP3: pEFS rates in MRD <0.01 × 10⁻⁴ and ≥0.01 × 10⁻⁴ groups at TP3 were 81.7 ± 2.4% and 25.0 ± 15.3% (p < 0.001). (E) pEFS rates between different risk groups: pEFS rates in SR, IR and HR groups were 81.8 ± 2.7%, 72.7 ± 5.5% and 8.3 ± 14.2% (p = 0.031).