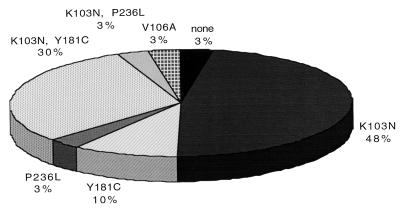
FIG. 1.
HIV-1 reverse transcriptase mutations in isolates from patients in ACTG 260. The pie chart represents the frequency of RT mutations in week 8 isolates. Isolates from a total of 30 patients were analyzed. None of the mutations represented here was present in the corresponding baseline isolates.

