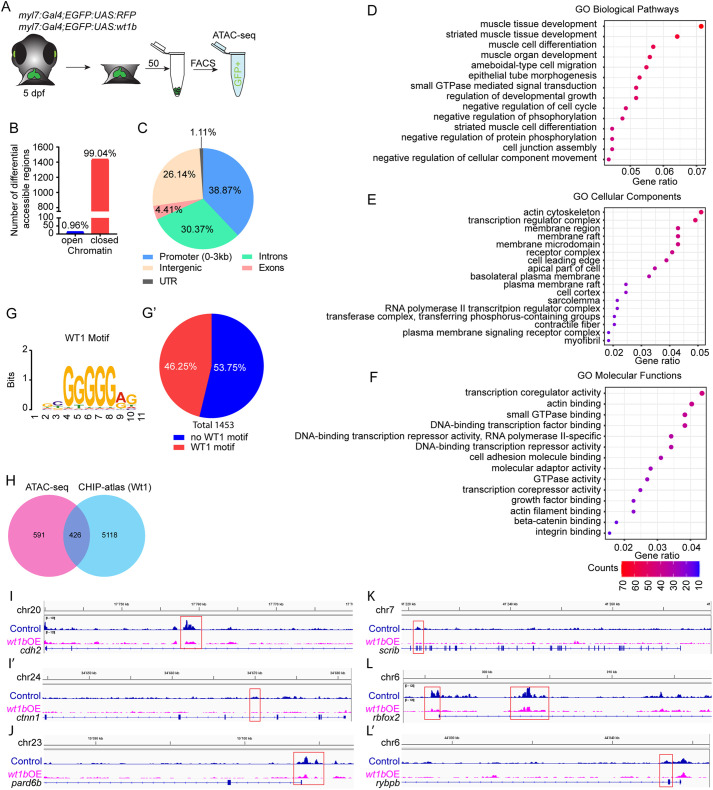
Fig. 6.
Assay for transposase-accessible chromatin sequencing (ATAC-seq) in wt1b-overexpressing cardiomyocytes. (A) Schematic representation of cell acquisition for ATAC-seq. (B) Graphical representation of number of differential accessible regions between myl7:Gal4;eGFP:UAS:RFP and myl7:Gal4;eGFP:UAS:wt1b cardiomyocytes at 5 days post-fertilization (dpf). (C) Distribution of the genomic regions with differential accessible regions. (D-F) Gene ontology (GO) pathway enrichment for differential accessible regions in cardiomyocytes after wt1b overexpression. (D) Selected GO biological pathway enrichment out of the top 25. (E) Selected GO cellular components enrichment out of the top 25. (F) Selected GO molecular functions enrichment out of the top 25. The color scale indicates the number of genes enriched in a pathway. All pathways have enrichments significance P-adjust ≤0.05. (G,G′) MEME-Centrimo Wt1 motif analysis. (G′) Percentage of the differential accessible regions in which the Wt1 motif is represented. (H) Venn diagram comparing the number of differential accessible regions that are common between the ATAC-seq and the CHIP-atlas database for Wt1. (I-L′) Sequencing tracks for genes with differential peaks within their genomic loci. Genes representing the following are shown: adherens junctions, cdh2 (I) and ctnn1 (I′); apical polarity, pard6b (J); basal polarity, scrib (K); and sarcomere assembly, rbfox2 (L) and rybpb (L′).

