

Abstract
Background
ADAM‐like decysin‐1 (ADAMDEC1) has been reported to play an important role in the pathogenesis of multiple diseases, including cancers. However, its biological role in non‐small cell lung cancer (NSCLC) remains largely unknown. Here, we aimed to investigate the biological functions and potential mechanism of ADAMDEC1 in NSCLC.
Methods
We verified ADAMDEC1 as a DEG by a comprehensive strategy of TCGA and GEO datasets miming and computational biology. Relative levels of ADAMDEC1 in NSCLC tissues and the adjacent peritumoral tissues were identified by qRT‐PCR, WB and IHC staining. The biological function of ADAMDEC1 was determined by CCK8, EdU, colony formation assay, apoptosis, wound healing migration and transwell invasion assays. Then, an in vivo tumor formation assay was conducted to explore the effects of ADAMDEC1 on tumor growth.
Results
The mRNA and protein expression levels of ADAMDEC1 were upregulated in NSCLC tissues and cell lines. ADAMDEC1 expression was associated with clinicopathological characteristics and overall survival of patients with NSCLC. Knockdown of ADAMDEC1 could decrease proliferation and colony forming ability of NSCLC cells, and promoted cell apoptosis, whereas ADAMDEC11 overexpression has opposite effects in NSCLC cells both in vivo and in vitro. Furthermore, we identified ADAMDEC1 accelerates NSCLC progression via activation of the PI3K/ AKT pathway.
Conclusion
We verified that ADAMDEC1 promotes the progression of NSCLC via the PI3K/AKT pathway. These findings showed the potential of ADAMDEC1 to be used for therapeutic approaches in NSCLC.
Keywords: ADAMDEC1, apoptosis, non‐small cell lung cancer, prognosis, proliferation
Upregulated ADAMDEC1 in NSCLC is associated with poor prognosis. (a) Volcano plot chart showing the distribution of the DEGs in TCGA and GEO datasets. Upregulated genes are red; downregulated genes are green. (b) The expression level of ADAMDEC1 mRNA using RT‐PCR in NSCLC and normal tissues (n = 84); (c) The ADAMDEC1 protein expression level was significantly elevated in NSCLC tissues compared with adjacent normal tissues in selected 16 paired tissues. (d) ADAMDEC1 protein expression in NSCLC tissues and adjacent tissues (n = 16); (e) Representative images of ADAMDEC1 IHC staining of 84 patients in NSCLC and normal tissues (×400, scale bar 100 μm), respectively. (f) Overall survival curves for two groups defined by low and high expression of ADAMDEC1 in NSCLC patients. All results were representative of three separate experiments. ** p < 0.01; **** pP < 0.0001.

INTRODUCTION
Lung cancer is the most common cause of cancer death worldwide, with an estimated 1.6 million deaths each year. 1 In the United States, 228 820 new cases of lung cancer were reported in 2020. Among them, around 135 720 mortalities were reported annually. 2 Non‐small cell lung cancer (NSCLC) is the most frequently reported histological subtype and accounts for approximately 85% of all lung cancers. 3 NSCLC has the lowest 5‐year relative survival rate with ~19%, partly because of diagnosis at a distant stage and a paucity of late‐stage treatments. 2 , 4 NSCLC is a challenging diagnostic target due to the substantial diversity of neoplastic clones within tumors, and the difficulties associated with obtaining sufficient quantities of diagnostic material suitable for pathological and molecular evaluation. 5 Moreover, genetic alterations within the tumors change the molecular marker profile during the course of the disease. 6 Currently, most patients with advanced NSCLC are diagnosed using biopsies or cytology specimens, due to a lack of availability of resected tumor tissue. 7 Therefore, reliable biomarkers and underlying molecular mechanisms are needed to help make clinical decisions throughout the patient's disease trajectory to select the optimal oncological and surgical strategies.
The ADAM‐like decysin 1 (ADAMDEC1) is a secreted protein belonging to a disintegrin and metalloproteinase (ADAM) family. 8 The ADAMs are involved in diverse biological functions, including fertilization, adhesion, migration, and proteolysis. 9 , 10 Recently, ADAMs have been associated with neurological cancer and are likely to be involved in the formation or progression of tumors. 11 , 12 A study using cDNA microarray analysis showed that ADAMDEC1 gene expression was significantly higher in craniopharyngiomas than in normal tissue of the hypophysial stalk. 13 Recently, researchers have identified ADAMDEC1 initiates an FGF autocrine loop to promote stemness in cancer stem cells, and this loop can be targeted to reduce glioblastoma growth. 14 As a result, ADAMDEC1 is believed to be closely related to tumor development and progression. However, the exact physiological role of ADAMDEC1 still remains largely unknown, and neither the expression or function of ADAMDEC1 in NSCLC has previously been reported.
Here, for the first time, we demonstrated that ADAMDEC1 was highly expressed in the macrophages in tumor samples obtained from NSCLC patients and NSCLC cells. Upregulation of ADAMDEC1 promotes NSCLC cells oncogenicity both in vivo and in vitro. More importantly, we confirmed ADAMDEC1 accelerates the progression of NSCLC via the PI3K/ AKT pathway. In summary, our findings uncover a new mechanism that ADAMDEC1 promotes the progression of NSCLC via the PI3K/ AKT pathway.
METHODS
The cancer genome atlas data sets
Clinical information and transcriptional profiles of patients with NSCLC were obtained from the Gene Expression Omnibus (GEO, http://www.ncbi.nlm.nih.gov/geo) and The Cancer Genome Atlas (TCGA, https://portal.gdc.cancer.gov) according to the following selection criteria: (i) Basic clinical information of stage, age, gender, overall survival (OS) and survival status; (ii) based on the Affymetrix HG‐U133_Plus 2.0 platform or IlluminaHiSeq platform; and (iii) have a larger sample size (>200). Datasets were then compared to obtain the significant p‐value and the fold difference between the q‐value and the gene fold change for differential gene screening. These values were obtained with the following conditions: p‐value <0.01, a q‐value <0.05 and a fold change >2.
Collection of clinical samples
A total of 84 cases of cancer specimens and paired adjacent noncancerous tissues were collected from patients diagnosed with primary NSCLC in the Sun Yat‐sen University Cancer Center from March 2014 to September 2016. Ethical approval required was obtained from the Ethics Committee of Sun Yat‐sen University Cancer Center and was performed in line with the Declaration of Helsinki (as revised in 2013). A written consent was signed by each patient before sample collection. Tissue specimens were frozen in liquid nitrogen for subsequent use.
Immunohistochemistry (IHC) and Ki 67 staining
For IHC, the paraffin sections were sequentially deparaffinized for antigen retrieval, endogenous peroxidase inactivation, blocking with goat serum (Gibco), and incubation with ADAMDEC1 (proteintech; #17899‐1‐AP; 1:200 dilution) or Ki67 (abcam; #ab15580; 1:400 dilution) primary antibodies and secondary antibodies (abcam; #ab205718; 1:1000 dilution). The slices were visualized and photographed with phase contrast microscope (Leica, Cat. No. DMI 1).
Cell culture
The human NSCLC cell lines A549, NCI‐H1299, HCC827, NCI‐1650 and NCI‐H358 were procured from the National Collection of Authenticated Cell Cultures (Shanghai, China), and the human normal lung epithelial cell line DEAS‐2B was provided by Beyotime. A549 cells were cultured in DMEM/F12 medium (Procell) containing 10% fetal bovine serum (FBS, Gibco). BEAS‐2B, NCI‐H1299, HCC827, NCI‐1650 and NCI‐H358 cells were cultured in RPMI 1640 medium (Procell) containing 1% glutamax (Invitrogen), 1% (v/v) 100 mM sodium pyruvate solution (Invitrogen) and 10% FBS. All cells were maintained in a humidified chamber supplemented with 5% CO2.
Western blotting assay
The expression levels of ADAMDEC1 in cultured cell lines and tumor tissues were detected by western blotting. Total proteins from cells and tissues were extracted and lysed by RIPA bufer (Beyotime) containing protease and phosphatase inhibitors (Genebase). The concentration of extracted protein was examined using Pierce BCA protein assay kit (Thermo Scientific). Protein extracts (30 μg) were separated on 10–12% sodium dodecyl sulfate–polyacrylamide gel electrophoresis (SDS‐PAGE) and then transferred to polyvinylidene fluoride (PVDF) membranes (Millipore). Commercial primary antibodies including ADAMDEC1 (proteintech; #17899‐1‐AP; 1:1000 dilution), PI3K antibody (ab133595, 1:1000), phosphorylated PI3K antibody (phospho Y607, ab182651, 1:800), AKT antibody (ab18785, 1.5 μg/ml), phosphorylated AKT antibody (phospho T308, ab8933, 1:800), p38 antibody (ab170099, 1:1200), phosphorylated p38 antibody (phospho T180, ab178867, 1:1000), and GAPDH antibody (ab9485, 1:1000) were incubated with the PVDF membrane overnight at 4°C. The primary antibodies were then probed using the appropriate secondary antibodies at room temperature for 1 h, followed by ECL Western blotting detection system (Amersham) for detecting a protein signal band. GAPDH served as an endogenous reference and each experiment was run in triplicate. The results of western blotting bands were quantified using Image J software (Rawak Software Inc).
Real‐time polymerase chain reaction test
The total RNA was extracted from the cell lines or tissues using a Trizol reagent (Invitrogen). Using a Bestar qPCR RT kit (DBI Bioscience, no. 2220), cDNA was synthesized from the total RNA. The forward primers for ADAMDEC1 were as follows: 5′‐GGCCTTGGTAGGTATGGAAATC‐3′ and 5′‐ CCCCAGGTTAGAACTGTGCC ‐3′ for the reverse primers. The forward primers for GAPDH were as follows: 5′‐CTCCTCCTGTTCGACAGTCAGC‐3′; 5’‐CCCAATACGACCAAATCCGTT‐3′ for the reverse primers. ADAMDEC1 expression was analyzed with the real‐time polymerase chain reaction (RT‐PCR) test using the Bestar qPCR MasterMix (DBI Bioscience, no. 2043). GAPDH was used as a control, and the 2 − ΔΔCt method for the relative quantitation of gene expression was used to determine mRNA expression levels. 15
Immunofuorescence (IF)
Immunofluorescence staining for cells was performed as previously described. 16 In brief, cell fixation was performed with 15 min incubation in paraformaldehyde (4%) prior to permeabilization at 4°C using Triton X‐100 (0.1% in PBS) for 10 min. Following overnight probing with ADAMDEC1 primary antibody (1:100 dilution), secondary antibody was administered for 60 min at room temperature. DAPI stained nuclei through a 5 min incubation allowing a laser scanning confocal microscope (Zeiss) to visualize sealed coverslips.
Wound healing analysis
Essen Bioscience supplied the Image‐lock plates on which 100 000 cells were distributed in the 96 well plates. Prior to creating scratch wounds with a wound maker from the same supplier, single‐layer cell confluence was ensured by visualization through a light microscope, and then 1% FBS was substituted for the original medium and plates transferred to IncuCyte ZOOM live cell‐imaging system also from Essen Bioscience. Cumulative photos of spreading cells were captured hourly over a complete 24‐h period.
Transfection and plasmid construction
The NCI‐H1299 and the HCC827 cells were transfected with either shRNA or plasmid by lipofectamine 2000 following the manufacturer's protocol. The sense sequence of ADAMDEC1 short hairpin (sh) RNA ‐shADAMDEC1 was: 5′‐CCTTGGTAGGTATGGAAATCT‐3′. The sh‐negative control (NC)‐shCTRL was 5′‐GTATGACAACAGCCTCAAG‐3′. The ADAMDEC1 overexpression plasmid pcDNA4.0‐ADAMDEC1 and empty plasmid pcDNA4.0 were obtained from Synbio Technologies Co. Ltd. Cells were then transfected with designed vectors using lipofectamine 2000 reagent (Invitrogen). After passing 8 h of the experiment, the medium was replaced. Cells transfected for 24 h were then harvested to be used in further experiments.
CCK‐8 assay and colony formation
Cell proliferation ability was measured using a cell counting kit‐8 (CCK‐8, Dojindo Laboratories). Then, 2 × 10³ cells were seeded into a 96‐well plate per well with three duplications, followed by incubation for 2 h at 37°C. Absorbance was detected at 450 nm daily for three consecutive days. For colony formation assay, 1.5 × 10³ treated cells were coated into 6‐well plates with three repetitions. After 14‐days incubation, the plates were washed with phosphate buffered saline (PBS) twice, fixed with methanol for 10 min and stained with 0.1% crystal violet solution within 10 min for further analysis.
EDU assay
A 5‐ethynyl‐20‐deoxyuridine (EDU) assay kit (Ribobio) was adopted for cell proliferation. Cells were then seeded into confocal plates with a density of 10 × 105 cells per well and incubated with 50 μM EDU buffer at 37°C for 2 h, fixed with 4% formaldehyde for 0.5 h and permeabilized with 0.1% Triton X‐100 for 20 min. EDU solution was added to culture which was followed by staining of the nuclei with Hoechst. The results were then visualized with a fluorescence microscope.
Apoptosis assay
Flow cytometry was used to detect the apoptotic rate. pcDNA4.0 vector, pcDNA4.0‐ ADAMDEC1 vector, NC‐shRNA, or ADAMDEC1‐shRNA transfected NCI‐H1299 and the HCC827 cells were plated into 6‐well plates and grown to 90% confluence. Following incubation, cell suspensions were harvested and incubated with 10 μl Annexin V‐FITC/PI apoptosis kit (Lianke Biotech Co Ltd ) staining for 10–15 min at room temperature avoiding light. The cells were then analyzed using a flow cytometer (FACSCalibur, BD Biosciences).
Terminal deoxynucleotidyl transferase‐medimed dUTP nick‐end labeling (TUNEL) assay
A TUNEL assay was performed with the one step TUNEL kit (C1089, Beyotime Institute) as previously described. 17 Cells were washed with phosphate‐buffered saline twice and fixed in 4% paraformaldehyde. The apoptotic cells were visualized with TUNEL staining according to the manufacturer's instructions. Fluorescence density was assessed using Image Pro plus 6.0 software. For tumor tissue, briefly, tissue sections (3 μm) from each group were dewaxed. Following incubation with protease K (without DNase, 20 μg/ml) for 30 min at 37°C. After washing with PBS, the sections were incubated with 50 μl TUNEL reaction mixture for 60 min at 37°C in the dark. Subsequently, stained sections were washed with PBS and observed by fluorescence confocal microscope (Zeiss LSM710). The number of TUNEL positive cells was calculated in 10 randomly selected fields of six sections by Image J (Bio‐Rad Laboratories) for comparison.
Transwell invasion assays
Transwell invasion assays were performed using a 24‐well chamber (8‐μm‐pore size, Corning) with matrigel. In brief, 300 μl of a cell suspension in FBS‐free medium containing 5 × 10⁴ transfected cells were seeded in the upper chamber. At the same time, 700 μl of growth medium containing 10% FBS was placed in the lower chamber to stimulate cell invasion. After 24 h incubation in a 37°C incubator, cells that migrated to the lower chamber were fixed with 4% paraformaldehyde and stained with 0.5% crystal violet. Subsequently, the migrated and invaded cells were photographed and counted in five randomly selected five fields under an inverted light microscope (magnifcation, 200×).
Mice experiments
Four‐week old male athymic BALB/c nude mice were provided by the SLAC Laboratory Animal Co. (Shanghai, China). Experimental protocols were permitted by the Institutional Animal Care and Use Committee of Sun Yat‐sen University Cancer Center. Mice were kept in a specific pathogen‐free environment and randomly divided into five groups (six mice per group). Xenograft tumor models were established by subcutaneous injection of WT, stable transfection with pcDNA4.0 vector, pcDNA4.0‐ ADAMDEC1 vector, NC‐shRNA, and ADAMDEC1 ‐shRNA HCC827 cells (3 × 10⁷) into the left flank of nude mice. The volume and weight of the tumors were measured every 3 days for a total of 4 weeks. Tumor volume was measured using calipers and calculated according to the formula: V = length×width2 × 0.5. After 28 days, the mice were euthanized and tumors extracted for further analysis. The tissues were fixed in 4% paraformaldehyde for 24 h and processed for hematoxylin and eosin (H&E) staining as well as immunohistochemical staining for ki67 and ADAMDEC1. The primary antibody used in this analysis was as follows: ADAMDEC1 (proteintech; no. 17899‐1‐AP; 1:200 dilution) or Ki67 (abcam; no. ab15580; 1:400 dilution). The images were obtained under a brightfield microscope (Olympus).
Statistical analysis
All data were analyzed using GraphPad Prism 9.0 software (GraphPad) and are shown as the mean ± standard deviation (SD). Differences between the two groups were analyzed using the t‐test, and comparisons among multiple groups were applied by one‐way analysis of variance (ANOVA). Chi‐square test was used to assess the association between ADAMDEC1 level and clinical characteristics of NSCLC patients. The cutoff value to divide patients into high and low expression groups was defined as the median expression of ADAMDEC1. Kaplan–Meier method was used to plot survival curves and log‐rank test was utilized to compare difference. p < 0.05 was considered statistically significant.
RESULTS
Upregulated ADAMDEC1 in NSCLC is associated with poor prognosis
We initially identified the differentially expressed genes (DEGs) based on TCGA and GEO datasets. We found that ADAMDEC1 was significantly upregulated in both datasets (Figure 1a). To further evaluate ADAMDEC1 expression as a diagnostic marker for NSCLC, 84 pairs of clinical NSCLC tissues and matched adjacent tissues were selected to detect the expression levels of ADAMDEC1 mRNA using RT‐PCR. ADAMDEC1 mRNA expression in NSCLC tissues was significantly higher than in the adjacent tissues (p < 0.0001; Figure 1b), which was also identified by Western blot assay (Figure 1c‐d). To further confirm these findings, ADAMDEC1 protein was examined using IHC in NSCLC tissues (Figure 1e), ADAMDEC1 expression was frequently higher in NSCLC tumor tissue than in the adjacent tissue.
FIGURE 1.

Upregulated ADAMDEC1 in NSCLC is associated with poor prognosis. (a) Volcano plot chart showing the distribution of the DEGs in TCGA and GEO datasets. Upregulated genes are red; downregulated genes are green. (b) The expression level of ADAMDEC1 mRNA using RT‐PCR in NSCLC and normal tissues (n = 84); (c) The ADAMDEC1 protein expression level was significantly elevated in NSCLC tissues compared with adjacent normal tissues in selected 16 paired tissues. (d) ADAMDEC1 protein expression in NSCLC tissues and adjacent tissues (n = 16); (e) Representative images of ADAMDEC1 IHC staining of 84 patients in NSCLC and normal tissues (×400, scale bar 100 μm), respectively. (f) Overall survival curves for two groups defined by low and high expression of ADAMDEC1 in NSCLC patients. All results were representative of three separate experiments. **p < 0.01, ****p < 0.0001
NSCLC patients were divided into two groups according to the expression of ADAMDEC1 levels, with a median of 0.018. Those whose expression level was lower than this was set as the low expression group (n = 42), and those whose expression level was higher than 0.018 were set as the high expression group (n = 42). Kaplan–Meier analysis revealed that patients with lower ADAMDEC1 expression group yielded better overall survival rate (p = 0.0021; Figure 1f) compared to the high‐ ADAMDEC1 group. These results suggested that the expression of ADAMDEC1 was upregulated in NSCLC tissues and ADAMDEC1 expression can affect the survival prognosis in NSCLC patients.
Moreover, we investigated the relationship between ADAMDEC1 expression and clinicopathological features in 84 NSCLC patients. As shown in Table 1, high ADAMDEC1 expression was significantly associated with TNM stage (p = 0.0022), degree of tumor differentiation (p = 0.0011) and lymph node metastasis (p = 0.0088). However, a statistically significant association between ADAMDEC1 expression and age, gender, smoking status and histopathology type was not found. Taken together, we concluded that ADAMDEC1 is upregulated in NSCLC and is closely related to its poor prognosis.
TABLE 1.
Correlation between protein expression of ADAMDEC1 and clinicopathological features in 84 cases of NSCLC
| Factors | N | ADAMDEC1 expression (n = 84) | p‐value | |
|---|---|---|---|---|
| Low expression (n = 42) | High expression (n = 42) | |||
| Age | ||||
| <60 | 43 | 23 | 20 | 0.5126 |
| ≥60 | 41 | 19 | 22 | |
| Gender | ||||
| Male | 43 | 19 | 24 | 0.2751 |
| Female | 41 | 23 | 18 | |
| TNM stage | ||||
| I–II | 40 | 27 | 13 | 0.0022 |
| III–IV | 44 | 15 | 29 | |
| Differentiation | ||||
| Poor | 43 | 14 | 29 | 0.0011 |
| Well | 39 | 28 | 13 | |
| Lymph node metastasis | ||||
| Yes | 40 | 14 | 26 | 0.0088 |
| No | 44 | 28 | 16 | |
| Smoking status | ||||
| Smoker | 41 | 19 | 22 | 0.5126 |
| Nonsmoker | 43 | 23 | 20 | |
| Histopathology type | ||||
| Adenocarcinoma | 39 | 23 | 16 | 0.1257 |
| Squamous cell carcinoma | 45 | 19 | 26 | |
Abbreviation: NSCLC, non‐small cell lung cancer.
Overexpression of ADAMDEC1 promotes the proliferation of NSCLC cells
To evaluate the possible role of ADAMDEC1 in NSCLC, the NSCLC cell lines were chosen for knockdown or overexpression of ADAMDEC1. ADAMDEC1 expression was measured in five NSCLC cell lines as well as BEAS‐2B cells. RT‐PCR and Western blot analysis results indicated that ADAMDEC1 was upregulated in the NSCLC cell lines, and its expression was highest in the NCI‐H1299 cell line (p < 0.001) and lowest in the HCC827 cell line (p < 0.01; Figure 2a, b). Therefore, the NCI‐H1299 and the HCC827 cell lines were selected for silencing ADAMDEC1 using shRNA. In addition, we also established the NSCLC cells (NCI‐H1299 and HCC827) with overexpression of plasmids mediated ADAMDEC1 overexpression, which was validated by qRT‐PCR and Western blotting (Figure 2c, d). Moreover, immunofluorescence also confirmed the above experimental results (Figure 2e).
FIGURE 2.
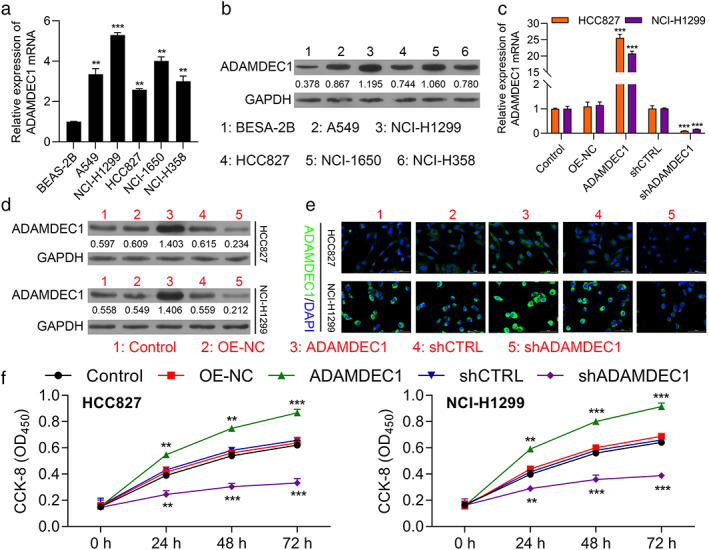
Overexpression of ADAMDEC promotes the proliferation of NSCLC cells. (a) The ADAMDEC1 expression in NSCLC cells and human normal lung epithelial cell line DEAS‐2B determined by RT‐PCR. (b) WB assay to determine the ADAMDEC1 expression in NSCLC cells. (c) ADAMDEC1 mRNA expression in HCC827 and NCI‐H1299 cells transfected with pcDNA4.0 vector, pcDNA4.0‐ ADAMDEC1 vector, CTRL‐shRNA, or ADAMDEC1‐shRNA were determined by RT‐qPCR. (d) ADAMDEC1 protein expression in HCC827 and NCI‐H1299 cells transfected with indicated vectors, which divided into five groups, including CTRL, OE‐NC, OE‐ADAMDEC1, shCTRL and shADAMDEC1. (e) Representative images from HCC827 and NCI‐H1299 cells transfected with aforementioned vectors or shRNAs stained for ADAMDEC1 (green); nuclei were counterstained with DAPI (blue). (f) CCK8 assay was used to compare the cell proliferation of CTRL, OE‐NC, OE‐ ADAMDEC1, shCTRL and sh ADAMDEC1 groups in HCC827 and NCI‐H1299 cells. CTRL, negative control, OE, overexpression. Data represent mean values ± SD from three replicates of each sample. **p < 0.01; ***p < 0.001
Then, CCK8, colony forming assays, and EDU assays were performed to determine the influence of ADAMDEC1 on cell proliferation. As shown in Figure 2f, cell proliferation was significantly accelerated in the ADAMDEC1 overexpression group compared with that in negative control group (OE‐NC) in NCI‐H1299 and HCC827 cells (p < 0.001). Similarly, ADAMDEC1‐knockdown cells proliferated less compared with the shCTRL group (p < 0.001). In addition, the EDU assay implied that cell growth was increased with ADAMDEC1 overexpression while decreased with ADAMDEC1 knockdown (Figure 3a). Moreover, a colony formation assay was conducted to evaluate the colony formation ability of NSCLC cells. As shown in Figure 3b, an increased number of colonies was observed in the cells transfected with ADAMDEC1 overexpression vector (pcDNA4.0‐ ADAMDEC1) (p < 0.01), while the opposite phenomenon was observed in the shADAMDEC1 group (shADAMDEC1) compared with that in shCTRL group in NCI‐H1299 and HCC827 cells. These results provide the evidence that ADAMDEC1 promotes the proliferation of NSCLC cells.
FIGURE 3.

Overexpression of ADAMDEC1 promotes the proliferation of NSCLC cells. (a) EDU assay was applied to compare the cell proliferation ability of CTRL, OE‐NC, OE‐ ADAMDEC1, shCTRL and shADAMDEC1 groups in HCC827 and NCI‐H1299 cells (scale bar, 100 μm); (b) Colony formation capacity of CTRL, OE‐NC, OE‐ ADAMDEC1, shCTRL and shADAMDEC1 groups in HCC827 and NCI‐H1299 cells; data represent mean values ± SD from three replicates of each sample; **p < 0.01
ADAMDEC1 suppresses apoptosis of NSCLC cells
Apoptosis is one of the major factors which regulates the degree of malignancy in NSCLC. To investigate whether ADAMDEC1 acts as a cancer suppressor through regulation of apoptosis, we examined apoptosis via TUNEL and FCM assays. The results of the TUNEL assay showed that cell apoptosis of NCI‐H1299 and HCC827 cells was significantly decreased in the OE‐ADAMDEC1 group, compared to the OE‐NC group (Figure 4a). On the contrary, ADAMDEC1 knockdown greatly increased NCI‐H1299 and HCC827 cells apoptosis. In addition, the result of flow cytometry showed that compared with the shCTRL group, the apoptosis rate was increased in the shADAMDEC1 transfected cells while decreased in the ADAMDEC1 overexpression cells (Figure 4b). These data showed ADAMDEC1 suppresses apoptosis of NSCLC cells in vitro.
FIGURE 4.

ADAMDEC1 inhibited apoptosis of NSCLC cells. (a) Tunel assay was applied to compare the cell apoptosis of CTRL, OE‐NC, OE‐ ADAMDEC1, shCTRL and shADAMDEC1 groups in HCC827 and NCI‐H1299 cells (scale bar, 100 μm). (b) The ratio of apoptosis in the HCC827 and NCI‐H1299 cells transfected with indicated vectors, which consisting of the CTRL, OE‐NC, OE‐ ADAMDEC1, shCTRL and shADAMDEC1 groups were detected by flow cytometry. Comparison of the ratio of apoptosis in the aforementioned five groups. Each bar indicates the mean apoptosis rate ± standard deviation per group. *p < 0.05; **p < 0.01
ADAMDEC1 promotes the migration and invasion abilities of NSCLC cells
Wound healing and transwell assays were conducted to evaluate the migratory and invasive capacities of NSCLC cells influenced by ADAMDEC1. Consistent with our previous hypothesis, we found that the downregulation of ADAMDEC1 remarkably inhibited cell migration (Figure 5a) and invasion abilities (Figure 5b). On the contrary, ADAMDEC1 overexpression remarkably enhanced cell migration (Figure 5a) and invasion (Figure 5b). These results further confirm that ADAMDEC1 acts as a tumor accelerator in NSCLC.
FIGURE 5.

ADAMDEC1 promotes the migration and invasion abilities of NSCLC cells. (a) Migration ability of HCC827 and NCI‐H1299 cell lines transfected with indicated vectors, which consisting of the CTRL, OE‐NC, OE‐ ADAMDEC1, shCTRL and shADAMDEC1 groups were detected by wound healing assay. Quantification was performed to determine the migration distance. (b) Invasion assay was applied to compare the cell invasive capacity of CTRL, OE‐NC, OE‐ ADAMDEC1, shCTRL and shADAMDEC1 groups in HCC827 and NCI‐H1299 cells. Quantification was performed to determine the invasion cells per field. **p < 0.01
ADAMDEC1 accelerates the progression of NSCLC cells via the PI3K/ AKT pathway
We hypothesized that ADAMDEC1 might have promoted NSCLC cell proliferation by upregulation of PI3K/ AKT/ p38 signaling. We performed western blotting in order to determine the changes in the expression levels of p‐PI3K, p‐AKT and p‐38. The increased protein levels of p‐PI3K, pAKT and p‐p38 induced by ADAMDEC1 overexpression in PI3K/ AKT demonstrated substantial upregulation upon transfection with ADAMDEC1 (Figure 6). Therefore, we conclude that ADAMDEC1 promotes NSCLC progression at least to some extent via activation of the PI3K/ AKT pathway.
FIGURE 6.

ADAMDEC1 accelerates the progression of NSCLC via the PI3K/ AKT pathway in vitro. (a, b) Expression level of PI3K, p‐PI3K, AKT, p‐AKT, p38, and p‐p38 in the HCC827 and NCI‐H1299 cells of the five groups (CTRL, OE‐NC, OE‐ ADAMDEC1, shADAMDEC1 and shADAMDEC1 groups) were determined by western blotting. (c–e) Densitometry analysis was performed to determine the protein expression. Data was normalized to GAPDH. All results were representative of three separate experiments. All results were representative of three separate experiments. **p < 0.01
Overexpression of ADAMDEC1 accelerates the growth of tumors via the PI3K/ AKT pathway
Finally, we established a xenograft tumor model to investigate the effect of ADAMDEC1 on tumor growth in vivo. pcDNA4.0 vector, pcDNA4.0‐ADAMDEC1 vector, NC‐shRNA, or ADAMDEC1‐shRNA transfected HCC827 cells were injected subcutaneously into the left flank of the athymic nude mice. Consistent with the results of previous cell experiments, the tumors of the ADAMDEC1 knockdown group (shADAMDEC1) were significantly smaller than those of the shCTRL group (p < 0.01), and the tumors of the ADAMDEC1 overexpression group (OE‐ADAMDEC1) were significantly greater than those of the negative control group (OE‐NC, p < 0.001) as shown in Figures 7a, b. ADAMDEC1 mRNA expression in five groups of tumors formed by different treated cells were determined by RT‐PCR (Figure 7c). Subsequently, IHC staining of xenograft tissues collected from nude mice demonstrated that knockdown of ADAMDEC1 could significantly inhibit the expression of Ki67, which is related to cancer differentiation (p < 0.01, Figure 7d, e). Moreover, the TUNEL assay showed that ADAMDEC1 overexpression (OE‐ ADAMDEC1) resulted in less cells apoptosis than the control (OE‐NC), However, apoptosis of NSCLC cells significantly increased in the ADAMDEC1 knockdown group (shADAMDEC1), compared to the shCTRL group (Figure 7f). Overall, these findings illustrated that inhibition of ADAMDEC1 could suppress NSCLC growth and differentiation. We also performed Western blotting to evaluate the change of p‐PI3K and p‐AKT expression. The results were consistent with the aforementioned cell experiment (Figure 7g). Therefore, we further confirmed that ADAMDEC1 promotes NSCLC progression via activation of the PI3K/ AKT pathway.
FIGURE 7.

Upregulation of ADAMDEC1 accelerates tumor growth in vivo. (a) Tumors formed 6 weeks post‐injection in BALB/C nude mice. Tumors in the CTRL, OE‐NC, OE‐ ADAMDEC1, shCTRL and shADAMDEC1 groups were isolated from mice at the endpoint of experiments. (b) Tumor growth was assessed by tumor volume measurement over time in the five afore mentioned groups (mean ± SD; n = 25). *p < 0.05; **p < 0.01; ***p < 0.001. Mice were anesthetized and sacrificed at experimental endpoints. Tumors were subsequently dissected. (c) ADAMDEC1 mRNA expression in tumors from CTRL, OE‐NC, OE‐ADAMDEC1, shCTRL and shADAMDEC1 groups; n = 5. (d) Representative images of ADAMDEC IHC, Ki67 and TUNEL staining in CTRL, OE‐NC, OE‐ ADAMDEC, shCTRL and shADAMDEC groups, respectively. (×400, scale bars, 100 μm). (e) Quantification of Ki‐67 positive cells number is shown in CTRL, OE‐NC, OE‐ ADAMDEC, shCTRL and shADAMDEC groups, respectively. (f) TUNEL assay of apoptosis in CTRL, OE‐NC, OE‐ ADAMDEC1, shCTRL, and shADAMDEC1 groups in tumor. (g) Expression level of PI3K, p‐PI3K, AKT, p‐AKT, p38 and p‐p38 in the tumors of the five groups (CTRL, OE‐NC, OE‐ADAMDEC1, shCTRL and shADAMDEC1 groups) shown by western blotting. *p < 0.05; **p < 0.01; ***p < 0.001
DISCUSSION
Tumor progression is frequently linked to the secretion of metalloproteinases that enable tissue invasion and intravasation by cancer cells via extracellular matrix (ECM) degradation. 18 This also causes a release of trophic factors to stimulate tumor growth, dispersal, and modulation of inflammatory responses. 19 There is evidence that the microenvironment of NSCLC is rich in different types of immune cells which are associated with clinical outcomes. 20 , 21 Thus, the quantitative molecular signature of tumor‐infiltrating immune cells is increasingly recognized as predictive biomarkers to enable personalized treatment selection and improve patient management.
Disintegrin metalloprotease ADAM‐like decysin‐1 (ADAMDEC1), an orphan ADAM‐like metalloprotease, is member of the ADAM‐family, 22 which has been found to be significantly upregulated in a great number of inflammatory diseases such as atherosclerosis, 23 pulmonary sarcoidosis, 24 and osteoarthritis. 25 Nevertheless, ADAMDEC1 has also been previously reported to be exclusively expressed in macrophages and mature dendritic cells. 26 , 27 Thus, ADAMDEC1 is believed to be closely related to inflammation. However, the exact physiological role of ADAMDEC1 still remains largely unknown. Whether ADAMDEC1 contributes to immunoassociated tumors such as NSCLC has as yet to be determined. Here, for the first time, we were able to demonstrate that ADAMDEC1 expression was significantly upregulated in NSCLC. Further efforts are encouraged to explore the mechanism of ADAMDEC1 in these inflammatory cancers.
The prototypic ADAM protein has a prodomain, metalloprotease domain, disintegrin domain, cysteine‐rich region, transmembrane domain, and variable cytoplasmic tail. 28 , 29 By contrast, ADAMDEC1 belongs to a novel ADAM subfamily and possesses only a partial disintegrin domain and lacks a cysteine rich domain. 8 The expression of ADAMDEC1 is upregulated during dendritic cell maturation and in sarcoidosis lung tissue, which suggests that this protein may play an important role in dendritic cell function and the pathogenesis of pulmonary sarcoidosis. 30 However, only a few studies have been conducted on the expression and role of ADAMDEC1 in cancer. Studies have shown that members of the A disintegrin and metalloproteinase (ADAM) family of zinc‐dependent proteinases contribute to glioblastoma multiforme (GBM) therapeutic resistance and invasiveness. 31 Meanwhile, studies have identified that ADAMDEC1 promotes the progression of glioma in vitro, 32 and Ana et al. 14 suggested that ADAMDEC1 works as an oncogene via maintaining a growth factor signaling loop in GBM stem cells, suggesting ADAMDEC1 as promising anticancer treatment targets. Nevertheless, ADAMDEC1 mRNA and protein expression levels have been found to be strikingly decreased in colon tumor tissues compared with normal colon tissues. 33 Previous results have showed that the role of ADAMDEC1 in tumors remain controversial. Thus, it is our hypothesis that ADAMDEC1 is linked to the proliferation of various tumors. We detected ADAMDEC1 mRNA and protein in NSCLC cells as well as in normal lung epithelial cell lines. We have also shown that upregulated ADAMDEC1 in NSCLC is associated with poor prognosis. Hence, suppression of ADAMDEC1 may be a useful approach to treat NSCLC in the future. More studies are needed to establish the role of ADAMDEC1 in the pathogenesis of NSCLC.
The PI3K/Akt pathway is a signaling network that promotes cell survival and proliferation, and plays a role in oncogenic transformation and in prevention of apoptosis. 34 Proteins involved in the PI3K/Akt pathway are abnormally expressed in several tumors, thereby leading to the progression of breast, gastric, nasal and pancreatic cancers, among others. 35 , 36 , 37 This pathway is closely associated with tumor proliferation, autophagy and migration. 38 , 39 , 40 Therefore, research on ADAMDEC1 and whether it targets the PI3K/AKT pathway may have great significance in the management of NSCLC. Here, we demonstrate that PI3K/AKT is critically involved in the regulation of ADAMDEC1 expression to maintain cancer cell survival and proliferations. This correlation is highly relevant for gaining a deeper understanding and guiding new treatment strategies of human cancers, pointing to a potential rationale to target the indicated signaling pathway for cancer therapy in general human malignancies with ADAMDEC1 high expression.
In conclusion, in our study, ADAMDEC1 was demonstrated to function as an oncogene upregulated in NSCLC. Moreover, higher expression of ADAMDEC1 was found to be correlated with a worse prognosis in NSCLC patients. Functionally, the downregulation of ADAMDEC1 was found to inhibit the proliferation, migration and invasion of NSCLC cells both in vitro and in vivo via blocking the PI3K/AKT pathway. Together, these findings suggest that ADAMDEC1 may serve as a potential novel predictive and therapeutic target for NSCLC.
CONFLICT OF INTEREST
The authors declare that they have no competing interests.
Zhu W, Shi L, Gong Y, Zhuo L, Wang S, Chen S, et al. Upregulation of ADAMDEC1 correlates with tumor progression and predicts poor prognosis in non‐small cell lung cancer (NSCLC) via the PI3K/AKT pathway. Thorac Cancer. 2022;13:1027–1039. 10.1111/1759-7714.14354
Weiliang Zhu and Lin Shi have contributed equally to this work and share first authorship.
Funding information National Natural Science Foundation of China, Grant/Award Numbers: 81874381, 82074159; Natural Science Foundation of Guangdong Province, Grant/Award Numbers: 2021A1515010491, 2021A1515011611
Contributor Information
Bei Zhang, Email: zb6336@126.com.
Bin Ke, Email: kebin@sysucc.org.cn.
REFERENCES
- 1. Schwartz AG, Cote ML. Epidemiology of lung cancer. Adv Exp Med Biol. 2016;893:21–41. [DOI] [PubMed] [Google Scholar]
- 2. Siegel RL, Miller KD, Jemal A. Cancer statistics, 2020. CA Cancer J Clin. 2020;70(1):7–30. [DOI] [PubMed] [Google Scholar]
- 3. Molina JR, Yang P, Cassivi SD, Schild SE, Adjei AA. Non‐small cell lung cancer: epidemiology, risk factors, treatment, and survivorship. Mayo Clin Proc. 2008;83(5):584–94. [DOI] [PMC free article] [PubMed] [Google Scholar]
- 4. Hoy H, Lynch T, Beck M. Surgical treatment of lung cancer. Crit Care Nurs Clin North Am. 2019;31(3):303–13. [DOI] [PubMed] [Google Scholar]
- 5. Herbst RS, Morgensztern D, Boshoff C. The biology and management of non‐small cell lung cancer. Nature. 2018;553(7689):446–54. [DOI] [PubMed] [Google Scholar]
- 6. Jonna S, Subramaniam DS. Molecular diagnostics and targeted therapies in non‐small cell lung cancer (NSCLC): an update. Discov Med. 2019;27(148):167–70. [PubMed] [Google Scholar]
- 7. Gridelli C, Rossi A, Carbone DP, Guarize J, Karachaliou N, Mok T, et al. Non‐small‐cell lung cancer. Nat Rev Dis Primers. 2015;1:15009. [DOI] [PubMed] [Google Scholar]
- 8. Bates EE, Fridman WH, Mueller CG. The ADAMDEC1 (decysin) gene structure: evolution by duplication in a metalloprotease gene cluster on chromosome 8p12. Immunogenetics. 2002;54(2):96–105. [DOI] [PubMed] [Google Scholar]
- 9. Takeda S. ADAM and ADAMTS family proteins and Snake venom metalloproteinases: a structural overview. Toxins (Basel). 2016;8(5):155. [DOI] [PMC free article] [PubMed] [Google Scholar]
- 10. Zhong S, Khalil RA. A Disintegrin and metalloproteinase (ADAM) and ADAM with thrombospondin motifs (ADAMTS) family in vascular biology and disease. Biochem Pharmacol. 2019;164:188–204. [DOI] [PMC free article] [PubMed] [Google Scholar]
- 11. Herrlich P, Herrlich A. ADAM metalloprotease‐released cancer biomarkers. Trends Cancer. 2017;3(7):482–90. [DOI] [PubMed] [Google Scholar]
- 12. Schumacher N, Rose‐John S, Schmidt‐Arras D. ADAM‐mediated Signalling pathways in gastrointestinal cancer formation. Int J Mol Sci. 2020;21(14):5133. [DOI] [PMC free article] [PubMed] [Google Scholar]
- 13. Xu J, Liu L, Zheng X, You C, Li Q. Expression and inhibition of ADAMDEC1 in craniopharyngioma cells. Neurol Res. 2012;34(7):701–6. [DOI] [PubMed] [Google Scholar]
- 14. Jimenez‐Pascual A, Hale JS, Kordowski A, Pugh J, Silver DJ, Bayik D, et al. ADAMDEC1 maintains a growth factor signaling loop in cancer stem cells. Cancer Discov. 2019;9(11):1574–89. [DOI] [PMC free article] [PubMed] [Google Scholar]
- 15. Livak KJ, Schmittgen TD. Analysis of relative gene expression data using real‐time quantitative PCR and the 2(‐Delta Delta C[T]) method. Methods. 2001;25(4):402–8. [DOI] [PubMed] [Google Scholar]
- 16. Im K, Mareninov S, Diaz MFP, Yong WH. An introduction to performing immunofluorescence staining. Methods Mol Biol. 2019;1897:299–311. [DOI] [PMC free article] [PubMed] [Google Scholar]
- 17. Wang XW, Tian RM, Yang YQ, Lu ZY, Han XD, Liu XS, et al. Triptriolide antagonizes triptolide‐induced nephrocyte apoptosis via inhibiting oxidative stress in vitro and in vivo. Biomed Pharmacother. 2019;118:109232. [DOI] [PubMed] [Google Scholar]
- 18. Najafi M, Farhood B, Mortezaee K. Extracellular matrix (ECM) stiffness and degradation as cancer drivers. J Cell Biochem. 2019;120(3):2782–90. [DOI] [PubMed] [Google Scholar]
- 19. Barnes TA, Amir E. HYPE or HOPE: the prognostic value of infiltrating immune cells in cancer. Br J Cancer. 2018;118(2):e5. [DOI] [PMC free article] [PubMed] [Google Scholar]
- 20. Sun J, Zhang Z, Bao S, Yan C, Hou P, Wu N, et al. Identification of tumor immune infiltration‐associated lncRNAs for improving prognosis and immunotherapy response of patients with non‐small cell lung cancer. J Immunother Cancer. 2020;8(1):e000110. [DOI] [PMC free article] [PubMed] [Google Scholar]
- 21. Stankovic B, Bjorhovde HAK, Skarshaug R, Aamodt H, Frafjord A, Muller E, et al. Immune cell composition in human non‐small cell lung cancer. Front Immunol. 2018;9:3101. [DOI] [PMC free article] [PubMed] [Google Scholar]
- 22. Lund J, Olsen OH, Sorensen ES, Stennicke HR, Petersen HH, Overgaard MT. ADAMDEC1 is a metzincin metalloprotease with dampened proteolytic activity. J Biol Chem. 2013;288(29):21367–75. [DOI] [PMC free article] [PubMed] [Google Scholar]
- 23. Papaspyridonos M, Smith A, Burnand KG, Taylor P, Padayachee S, Suckling KE, et al. Novel candidate genes in unstable areas of human atherosclerotic plaques. Arterioscler Thromb Vasc Biol. 2006;26(8):1837–44. [DOI] [PubMed] [Google Scholar]
- 24. Pasini FS, Zilberstein B, Snitcovsky I, Roela RA, Mangone FR, Ribeiro U Jr, et al. A gene expression profile related to immune dampening in the tumor microenvironment is associated with poor prognosis in gastric adenocarcinoma. J Gastroenterol. 2014;49(11):1453–66. [DOI] [PMC free article] [PubMed] [Google Scholar]
- 25. Balakrishnan L, Nirujogi RS, Ahmad S, Bhattacharjee M, Manda SS, Renuse S, et al. Proteomic analysis of human osteoarthritis synovial fluid. Clin Proteomics. 2014;11(1):6. [DOI] [PMC free article] [PubMed] [Google Scholar]
- 26. Liu T, Deng Z, Xie H, Chen M, Xu S, Peng Q, et al. ADAMDEC1 promotes skin inflammation in rosacea via modulating the polarization of M1 macrophages. Biochem Biophys Res Commun. 2020;521(1):64–71. [DOI] [PubMed] [Google Scholar]
- 27. Lund J, Elimar Bitsch AM, Gronbech Rasch M, Enoksson M, Troeberg L, Nagase H, et al. Monoclonal antibodies targeting the disintegrin‐like domain of ADAMDEC1 modulates the proteolytic activity and enables quantification of ADAMDEC1 protein in human plasma. MAbs. 2018;10(1):118–28. [DOI] [PMC free article] [PubMed] [Google Scholar]
- 28. Souza JSM, Lisboa ABP, Santos TM, Andrade MVS, Neves VBS, Teles‐Souza J, et al. The evolution of ADAM gene family in eukaryotes. Genomics. 2020;112(5):3108–16. [DOI] [PubMed] [Google Scholar]
- 29. Primakoff P, Myles DG. The ADAM gene family: surface proteins with adhesion and protease activity. Trends Genet. 2000;16(2):83–7. [DOI] [PubMed] [Google Scholar]
- 30. Crouser ED, Culver DA, Knox KS, Julian MW, Shao G, Abraham S, et al. Gene expression profiling identifies MMP‐12 and ADAMDEC1 as potential pathogenic mediators of pulmonary sarcoidosis. Am J Respir Crit Care Med. 2009;179(10):929–38. [DOI] [PMC free article] [PubMed] [Google Scholar]
- 31. Dong F, Eibach M, Bartsch JW, Dolga AM, Schlomann U, Conrad C, et al. The metalloprotease‐disintegrin ADAM8 contributes to temozolomide chemoresistance and enhanced invasiveness of human glioblastoma cells. Neuro Oncol. 2015;17(11):1474–85. [DOI] [PMC free article] [PubMed] [Google Scholar]
- 32. Liu X, Huang H, Li X, Zheng X, Zhou C, Xue B, et al. Knockdown of ADAMDEC1 inhibits the progression of glioma in vitro. Histol Histopathol. 2020;35(9):997–1005. [DOI] [PubMed] [Google Scholar]
- 33. Macartney‐Coxson DP, Hood KA, Shi H‐j, Ward T, Wiles A, O'Connor R, et al. Metastatic susceptibility locus, an 8p hot‐spot for tumour progression disrupted in colorectal liver metastases: 13 candidate genes examined at the DNA, mRNA and protein level. BMC Cancer. 2008;8:187. [DOI] [PMC free article] [PubMed] [Google Scholar]
- 34. Chelh I, Picard B, Hocquette JF, Cassar‐Malek I. Myostatin inactivation induces a similar muscle molecular signature in double‐muscled cattle as in mice. Animal. 2011;5(2):278–86. [DOI] [PubMed] [Google Scholar]
- 35. Marquard FE, Jucker M. PI3K/AKT/mTOR signaling as a molecular target in head and neck cancer. Biochem Pharmacol. 2020;172:113729. [DOI] [PubMed] [Google Scholar]
- 36. Alzahrani AS. PI3K/Akt/mTOR inhibitors in cancer: at the bench and bedside. Semin Cancer Biol. 2019;59:125–32. [DOI] [PubMed] [Google Scholar]
- 37. Sharma VR, Gupta GK, Sharma AK, Batra N, Sharma DK, Joshi A, et al. PI3K/Akt/mTOR intracellular pathway and breast cancer: factors, mechanism and regulation. Curr Pharm Des. 2017;23(11):1633–8. [DOI] [PubMed] [Google Scholar]
- 38. Park JY, Kang SE, Ahn KS, Um JY, Yang WM, Yun M, et al. Inhibition of the PI3K‐AKT‐mTOR pathway suppresses the adipocyte‐mediated proliferation and migration of breast cancer cells. J Cancer. 2020;11(9):2552–9. [DOI] [PMC free article] [PubMed] [Google Scholar]
- 39. Xu Z, Han X, Ou D, Liu T, Li Z, Jiang G, et al. Targeting PI3K/AKT/mTOR‐mediated autophagy for tumor therapy. Appl Microbiol Biotechnol. 2020;104(2):575–87. [DOI] [PubMed] [Google Scholar]
- 40. Wang Z, Jia L, sun Y, Li C, Zhang L, Wang X, et al. CORO1C is associated with poor prognosis and promotes metastasis through PI3K/AKT pathway in colorectal cancer. Front Mol Biosci. 2021;8(556):682594. [DOI] [PMC free article] [PubMed] [Google Scholar]