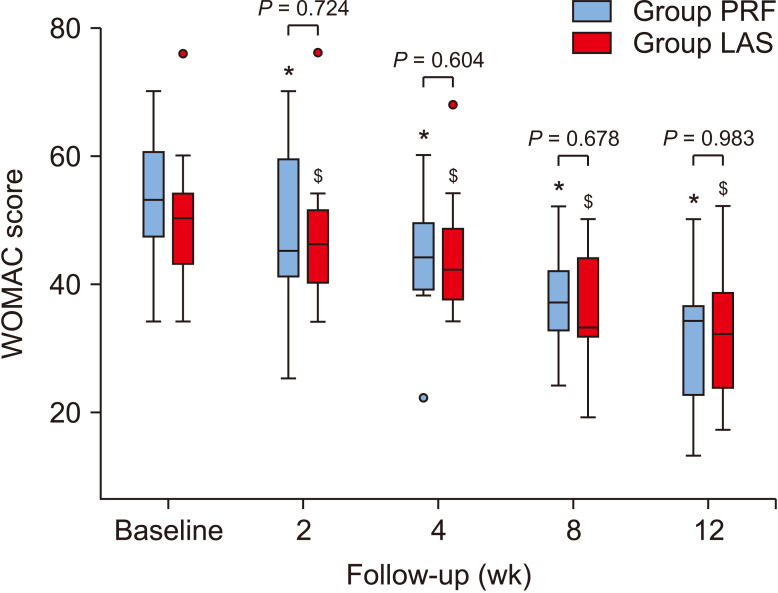
Fig. 3.
Box plot analysis of WOMAC score at various time intervals. Boxplots show the median, interquartile range and outliers. Box edge indicates 25th and 75th percentiles, Whiskers indicate 5th and 95th percentiles. Red/blue dots represent outliers. Within group comparison, WOMAC score were significant in both the PRF group and LAS group at various time interval of follow-up. Error bars indicate 95% confidence interval. WOMAC: Western Ontario and McMaster Universities Arthritis Index, PRF: pulsed radiofrequency, LAS: local anesthetic steroid. * indicates P < 0.05 compared to baseline in PRF group. $ indicates P < 0.05 compared to baseline in LAS group.

