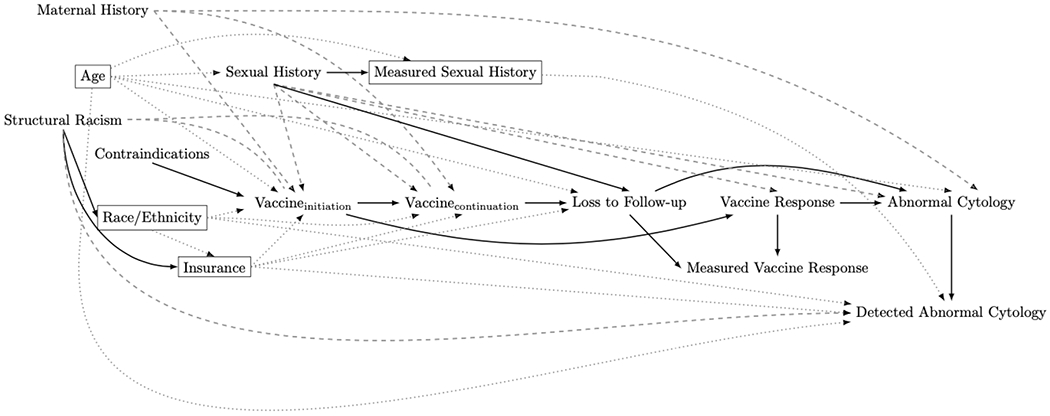
Figure 4:

Our final adjusted directed acyclic graph (DAG) depicting the relationship between vaccine dose and abnormal cervical cytology among people living with HIV that incorporates potential data issues. Rectangles indicate variables adjusted for, the dotted gray lines indicate complete removal of a path, and the dashed lines indicate confounding pathways.
