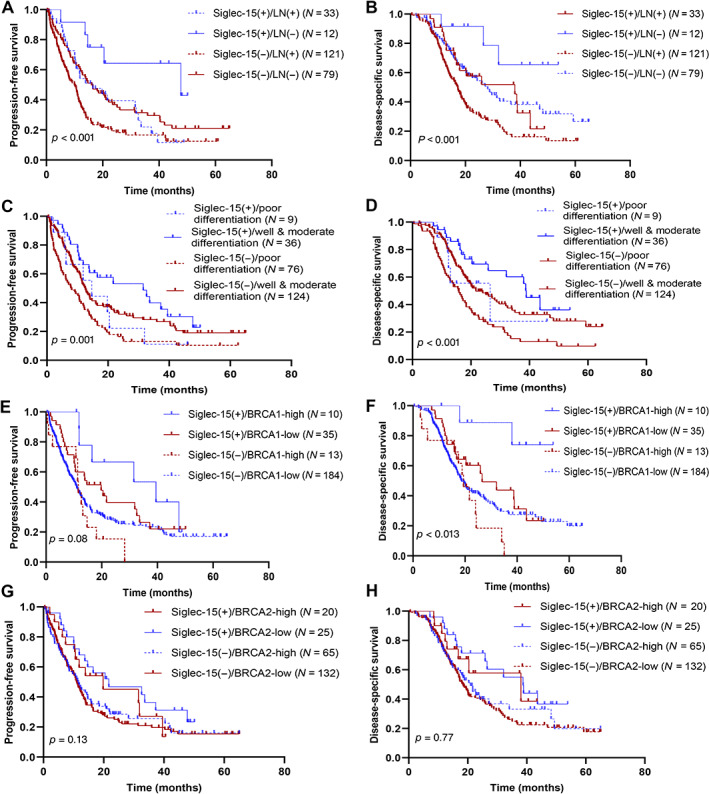
Figure 3.

Kaplan–Meier curves for (A, C, E, and G) PFS stratified by Siglec‐15 expression combined with lymph node status, grade, and BRCA1/2 status, and (B, D, F, and H) DSS stratified by Siglec‐15 expression combined with lymph node status, grade, and BRCA1/2 status.
