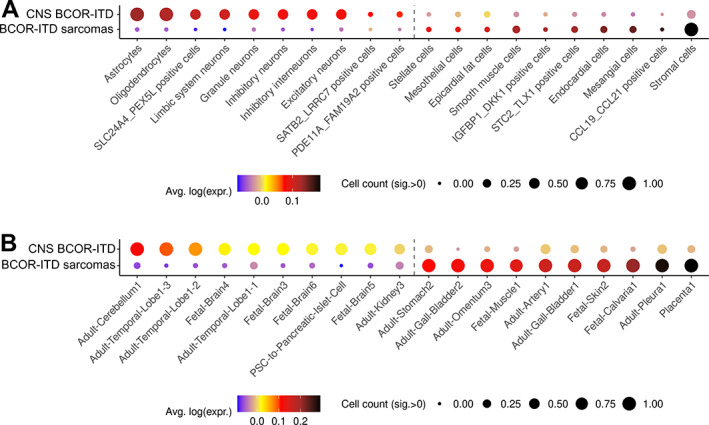
Figure 5.

Dot plot summarising the distributions of CNS BCOR‐ITD and BCOR‐ITD sarcoma signatures over cell types independently analysed by single‐cell/single‐nuclei RNA‐Seq. The signatures were computed from the DEGs between CNS BCOR‐ITD and the BCOR‐ITD sarcoma with a minimal fold‐change of 2.5. Dot colour represents the average of each distribution and size represents the count of cells within a cell type with a signature intensity strictly higher than 0 brought to the [0, 1] range: a gene signature is highly represented in a cell type of the atlas when the dot gets bigger (several cells of one type express the signature) and tends towards black colour (several genes of the signature are expressed within a cell type). (A) Dot plot of the CNS BCOR‐ITD signature (upper line) and the BCOR‐ITD sarcomas signature (lower lines) over selected cell types of the Cao et al's atlas. Only significant cell types are shown. The complete list of this atlas' cell types is shown in supplementary material, Figure S5. The number of genes in common between the signatures and the reference database is as follows: CNS BCOR‐ITD n = 114; BCOR‐ITD sarcomas n = 43. (B) Dot plot of the CNS BCOR‐ITD signature (upper line) and the BCOR‐ITD sarcoma signature (lower line) over selected cell types of the Han et al's atlas. Only significant cell types are shown. The complete list of this atlas' cell types is shown in supplementary material, Figure S5. Number of genes in signatures is also in the reference database: CNS BCOR‐ITD n = 103; BCOR‐ITD sarcomas n = 38.
