
Figure 3.
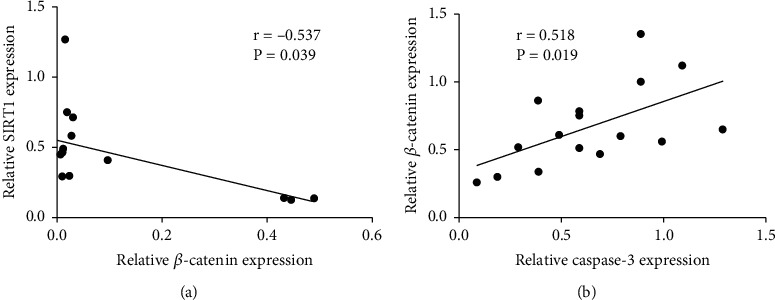
Correlation analysis of β-catenin and SIRT1 expression in spinal cord injury rats. (a) Correlation analysis of the relationship between SIRT1 and β-catenin. (b) Correlation analysis of the relationship between Caspase-3 and β-catenin. N = 16 per group.