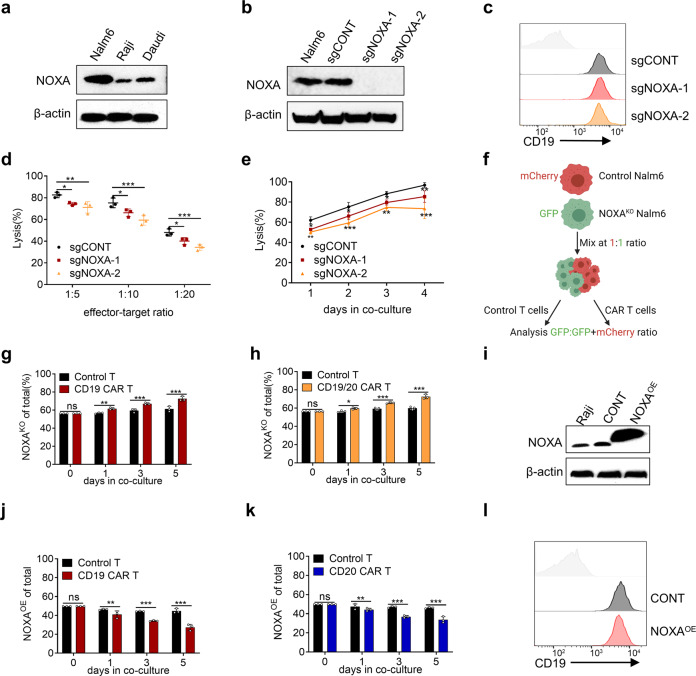
Fig. 2.
NOXA plays a pivotal role in resistance to CAR T cells. a Western blot analysis of NOXA protein levels in CD19+ B-lymphoid cell lines. b Western blot analysis of NOXA protein levels in the sgCONT and NOXAKO Nalm6 cell lines. c Flow cytometry analysis of the level of CD19 expression in the sgCONT and NOXAKO Nalm6 cell lines. d Cytotoxic analysis of sgCONT and NOXAKO Nalm6 cells cocultured with CD19 CAR T cells on day 2 at different E:T ratio. e Cytotoxic analysis of sgCONT and NOXAKO Nalm6 cells cocultured with CD19 CAR T cells (1:10 E:T ratio) over time. f Experimental design of growth competition assay. g, h mCherry+ sgCONT Nalm6 cells were combined with GFP+ NOXAKO Nalm6 cells at an ~1:1 ratio and cocultured with CD19 CAR T or tandem CD19/20 CAR T cells. The proportion of GFP+ tumor cells over time is shown. i Western blot analysis of NOXA protein levels in control and NOXAOE Raji cells. j, k mCherry+ control Raji cells were combined with GFP+ NOXAOE Raji cells at an ~1:1 ratio and cocultured with CD19 CAR T or CD20 CAR T cells. The proportion of GFP+ tumor cells over time is shown. l Flow cytometry analysis of the level of CD19 expression in control and NOXAOE cell lines. Differences among groups were calculated with two-way ANOVA tests. Values are shown as the mean ± SD of triplicates. *P < 0.05, **P < 0.01, and ***P < 0.001

