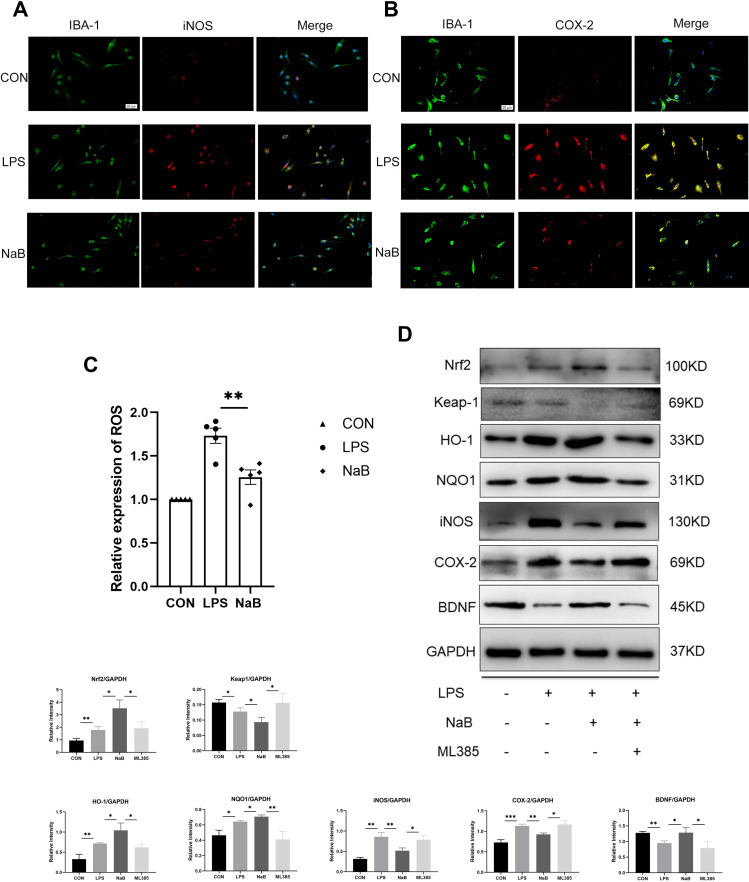
Figure 5.
Effect of NaB on neuroinflammatory molecules and Nrf2/HO-1 signaling in LPS-stimulated primary microglia. Primary microglia were incubated with LPS, LPS+NaB, or LPS+NaB+ML385 for 12 hours. (A and B) Immunofluorescence images of cultured primary microglia showing expressions of IBA-1 (green), iNOS (red) or COX-2 (red) and DAPI (blue) at 12 h after LPS or LPS+NaB treatment when compared with the corresponding control. (C) NaB treatment inhibits the LPS-induced ROS production in primary microglia. Cells were analyzed with microplate reader. (D) Western blot analysis of Nrf2, Keap1, HO-1, NQO1, iNOS, COX-2, and BDNF protein expressions in the primary microglia at 12h after LPS, LPS+NaB, and LPS+NaB+ML385 and their corresponding controls. GAPDH served as the loading control. Bar graphs depicting the optical density of Nrf2, Keap1, HO-1, NQO1, iNOS, COX-2, and BDNF expressions. Data presented as mean ± SD (n = 3 per group). Scale bars: 20µm. *P < 0.05, **P < 0.01 by one-way ANOVA.

