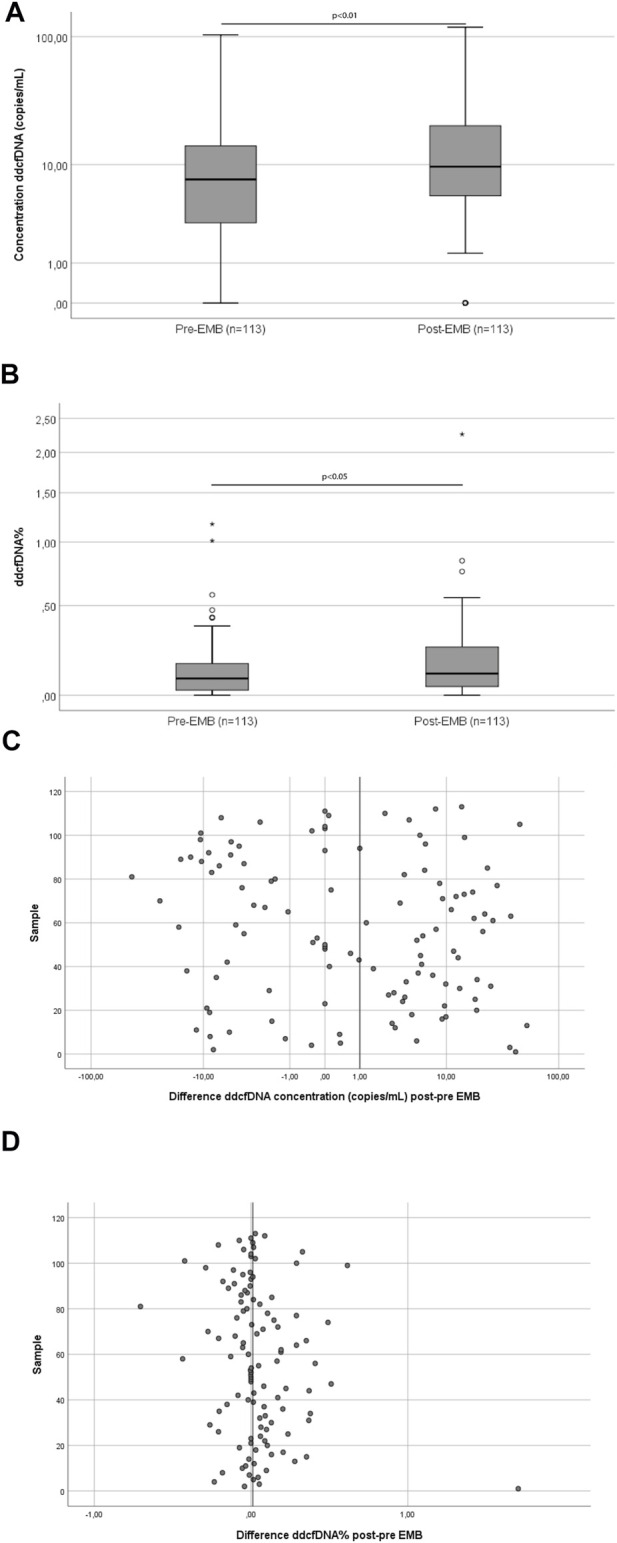
FIGURE 1.

Pairwise comparison of ddcfDNA concentration (A) and ddcfDNA% (B) and absolute differences in ddcfDNA concentration (C) and ddcfDNA% (D) of samples taken before and after the EMB procedure. The middle line of the box represents the median and the upper and lower borders of the box represent the 25 and 75% percentile. Whiskers represent the 5th–95th percentile and the small circles represent outliers (A,B). The vertical line on the x-axis represents the median differences (C,D). Abbreviations: EMB, endomyocardial biopsy.
