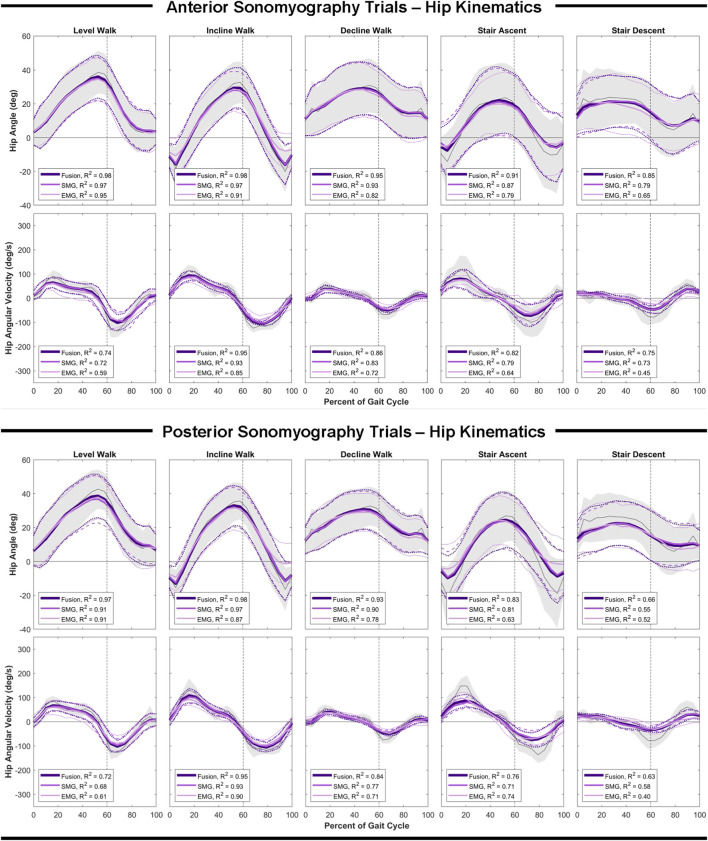
FIGURE 4.
Hip angle and angular velocity as a function of the gait cycle. Measured kinematics are displayed in gray with standard deviations in shaded regions. Predicted kinematics from Gaussian process regression models trained and tested on features from electromyography (EMG), sonomyography (SMG) and sensor fusion (Fusion) are displayed with respective standard deviations. Adjusted R2 given as a goodness-of-fit metric for each sensing modality compared to the measured kinematics.

