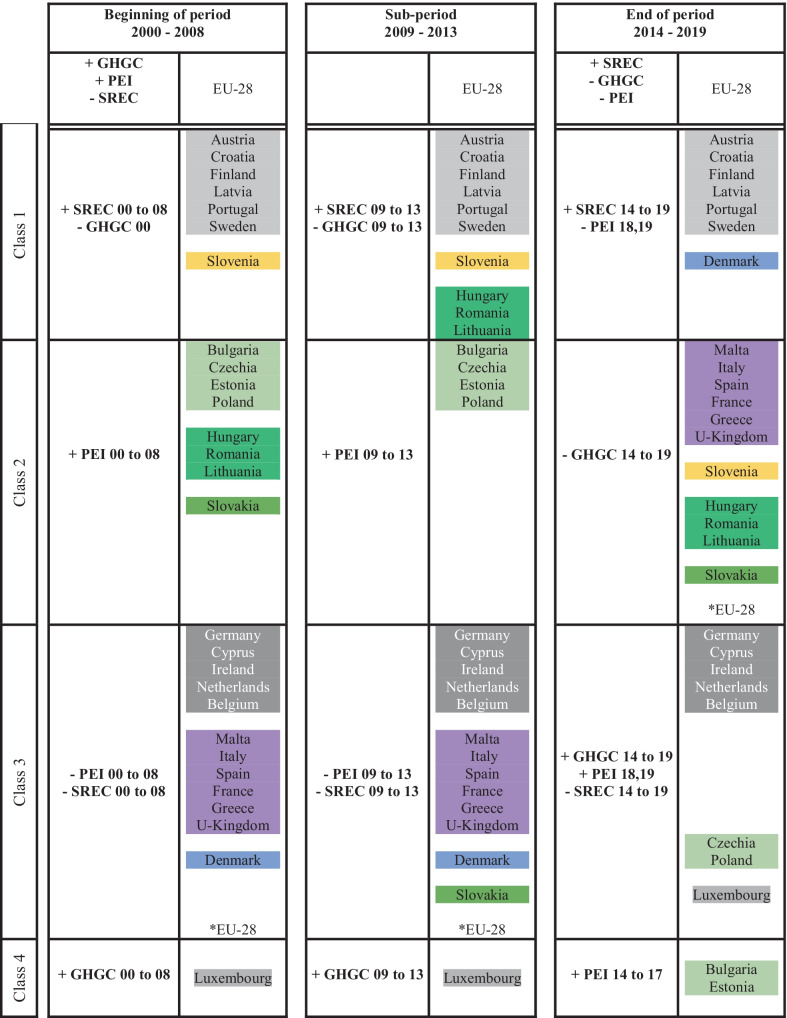
Table 3.
Energy transition trajectories of the 28 EU members over the three sub-periods
The variables presented in the table are significant at the 0.05 level. A sign ‘ − ’ (respectively ‘ + ’) indicates a significantly lower level (respectively higher) of the variable in the class considered compared to the average of the 28 countries. The years for which the variables are significant are specified following the names of the variables. The colors indicate a particular trajectory for a country or similar trajectories for groups of countries. It's a simple way to visualize models. These trajectories are discussed in the text.

