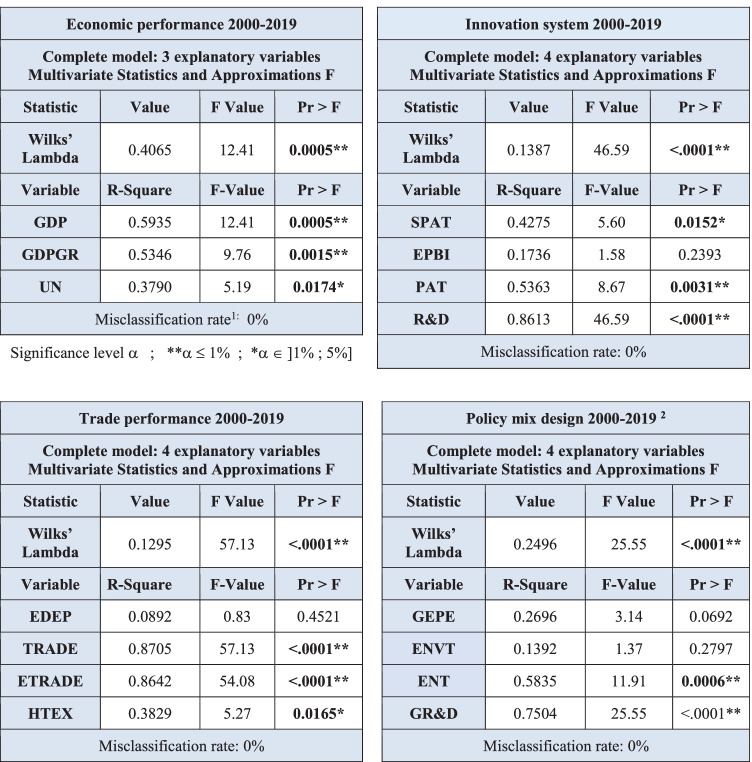
Table 4.
Temporal discriminant analyses over the full period 2000–2019 according to the four themes
1The misclassification rate is given to judge the predictive quality of the model
2Only four variables are available for the temporal analysis, the GEER&R variable was removed due to a lack of data for the period 2000–2003

