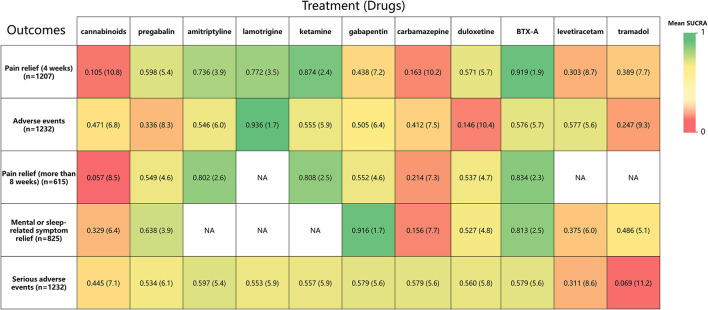
Figure 7.
A heat map of 11 treatment drugs studied in patients with SCI with neuropathic pain for 5 outcomes. Each column represents a treatment drug, and each row represents an outcome. For each outcome (Column 1), the number of studies included in the analysis is presented in parentheses. SUCRA, surface under the cumulative ranking curve. Each box is colored according to the mean SUCRA value of the corresponding treatment and outcome. The color scale consists of values that represent mean SUCRA, which ranges from 0 (red, indicating a treatment is always last) to 1 (green, indicating a treatment is always first). Uncolored boxes labeled NA (data not available) show that the underlying treatment was not included for that particular outcome. The values in each box represent the mean SUCRA value and mean rank of the corresponding drug and outcome.

