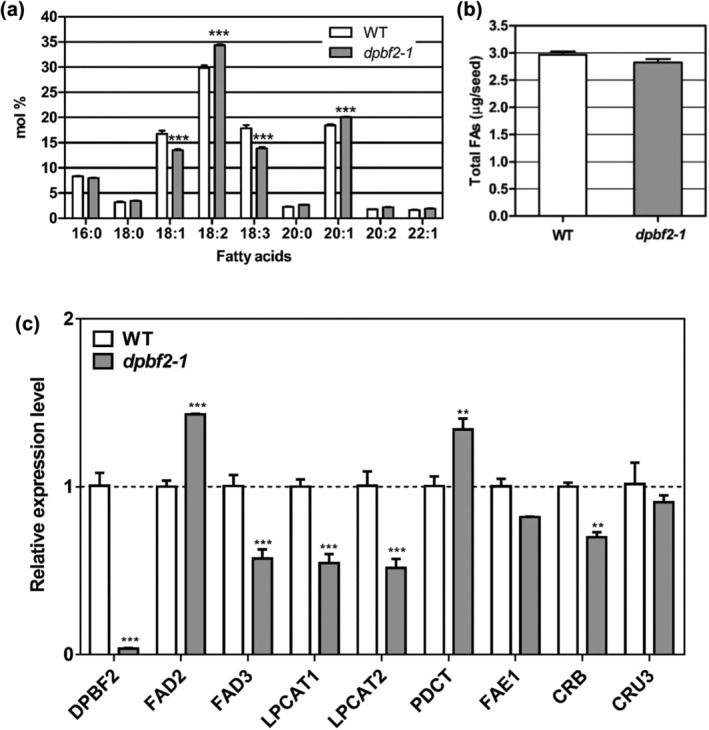
FIGURE 4.

Seed fatty acid content analysis and gene expression changes in WT and dpbf2‐1 knock‐out mutant. (a) Seed FA composition in WT and dpbf2‐1 line. Statistically significant differences are indicated by two‐way ANOVA with Bonferroni posttests (***p < .001). (b) Total fatty acid amount in WT and dpbf2‐1 line. A statistically significant test for total fatty acid amount was done by t test with Wilcoxon matched pairs test in 95% confidence intervals. Data represent the mean (±SE) from 10 independent biological replicates. (c) Gene expression changes in developing seeds of the WT and dpbf2‐1 line by RT‐qPCR analysis of DPBF2, FAD2, FAD3, LPCAT1/2, PDCT1, FAE1, CRB, and CRU3 transcript levels. The measurements are normalized to eIF4a. Statistically significant differences are indicated by one‐way ANOVA with Tukey t tests (**p < .01, ***p < .001)
