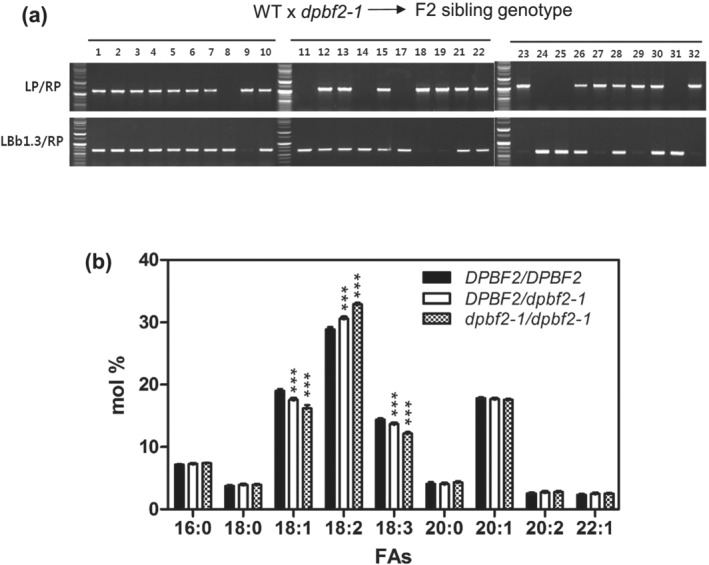
FIGURE 5.

Progeny segregation test for DPBF2 and its effect on FA composition. (a) The dpbf2‐1 homozygous mutant was crossed with WT and a progeny F1 heterozygous plant was selfed to produce F2 lines. The F2 plant seeds were germinated, and 30 individual plants were genotyped using genomic DNA PCR to identify WT and heterozygous or homozygous dpbf2‐1 T‐DNA genotypes. Genotyping of 30 F2 offspring resulted in 7 WT (DPBF2/DPBF2), 16 heterozygous (DPBF2/dpbf2‐1), and 7 homozygous (dpbf2‐1/dpbf2‐1). The dpbf2‐1 T‐DNA insertion locus segregates as a single copy. (b) The fatty acid composition in F2 segregants of DPBF2/dpbf2‐1 F1 heterozygous plants. Statistically significant differences from WT were determined by two‐way ANOVA with Bonferroni posttests (***p < .001)
