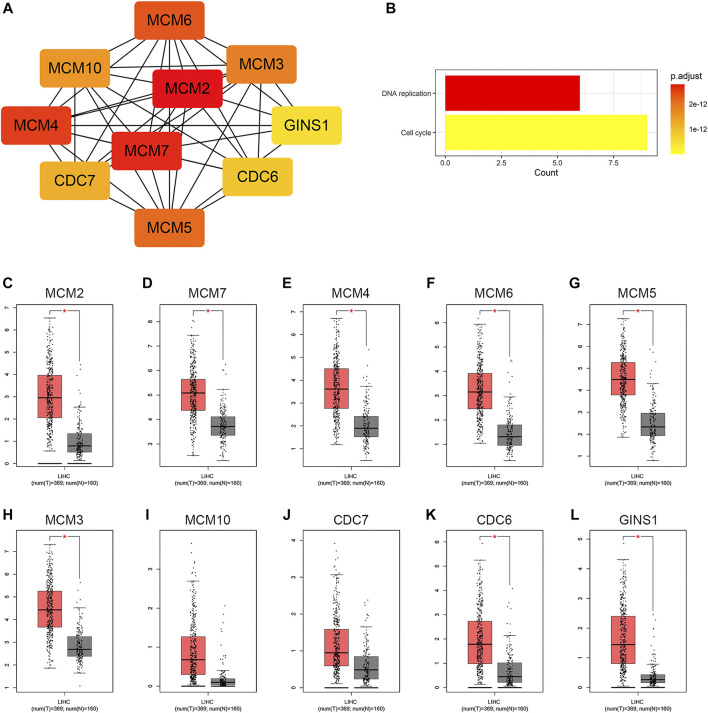
FIGURE 5.
Identification of hub genes in the PPI network. (A) Hub gene network. (B) KEGG pathway analysis of the hub genes. (C−L) Differential expression analysis of the hub genes in GEPIA. Tumor tissue is shown in red, and normal tissue is shown in gray. PPI, protein-protein interaction; KEGG, Kyoto Encyclopedia of Genes and Genomes; GEPIA, Gene Expression Profiling Interactive Analysis; LIHC, liver hepatocellular carcinoma; T, tumor; N, normal.

